Time Series Filters
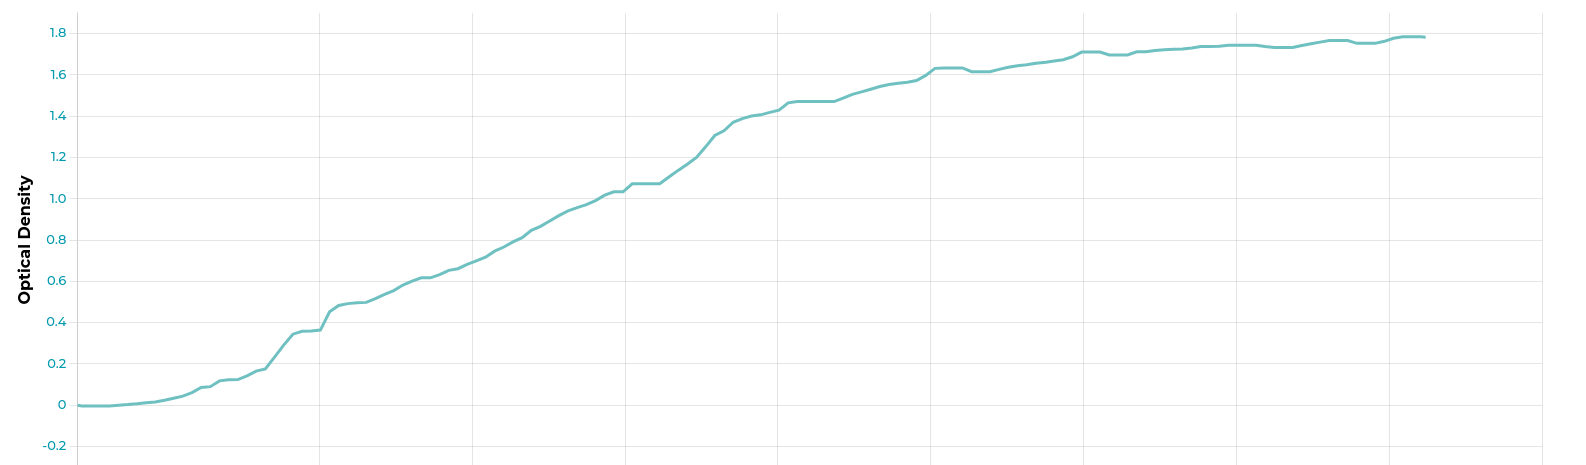
Labrador offers various time series filters to eliminate or accentuate extraneous noise. These filters are kernel-based filters where a kernel or window function is applied to the data in a given window. For instance, for the given dataset below, the window applied will result in a smoothened curve

Kernel Operation Options
Median: returns the median of values within the window
Gaussian average: Returns the Gaussian average of the values within the window
Exponential Moving Average (EMA) - alpha determines both the smoothing amount and window size. Is calculated with the following formula:
 where EMAt is the EMA at time t, Xt is the value of the time series at time t, 𝛼 is the smoothing factor between 0 and 1, and EMAt-1 is the EMA at the previous time step.
High-pass: Gaussian average subtracted from original data series to highlight high-frequency components
For each kernel function, the window size can be adjusted to affect the number of elements convoluted in the kernel. A larger window size will result in a more pronounced filter, but will also come with a larger time-offset compared to the original data set as window filtering techniques suffer from introducing lag to the input data.
For plate reader data, a default filter is applied as of Labrador v2.3.0. That filter consists of a median window function with a window size of 5, which results in minimum lag introduced
Time series filters can always be disabled or modified from the Graph Results tab in the experiment.
Note
Time series filters are applied by Labrador and not the cerillo device itself. Therefore, if you pull the data off of a device’s SD card, it may be slightly noisier than what is displayed and exported by Labrador.
Post-processing Data Flow
For experiments with both plate remapping and filter, the remapping is applied first, then time series filters are applied. Post-processed output is both displayed and exported from Labrador.

Post-processing data direct from device SD card
If your workflow involves pulling data directly from a cerillo device’s SD card, and you would like the benefits of Labrador post-processing you have a couple of options.
Import the data from the SD card using the import wizard from the File menu. Choose the Folder option to include any plate layout data, if applicable. The import wizard can also be opened from the Past Results Page
Post-process the data yourself with your favorite data tool. If using Excel, you can apply a simple low-pass filter to remove noise by applying a moving average or exponential trendline to your charted data. Matlab, R and other data-processing languages have built-in window functions that you can make use of to apply similar filters to your data.