Plate Results
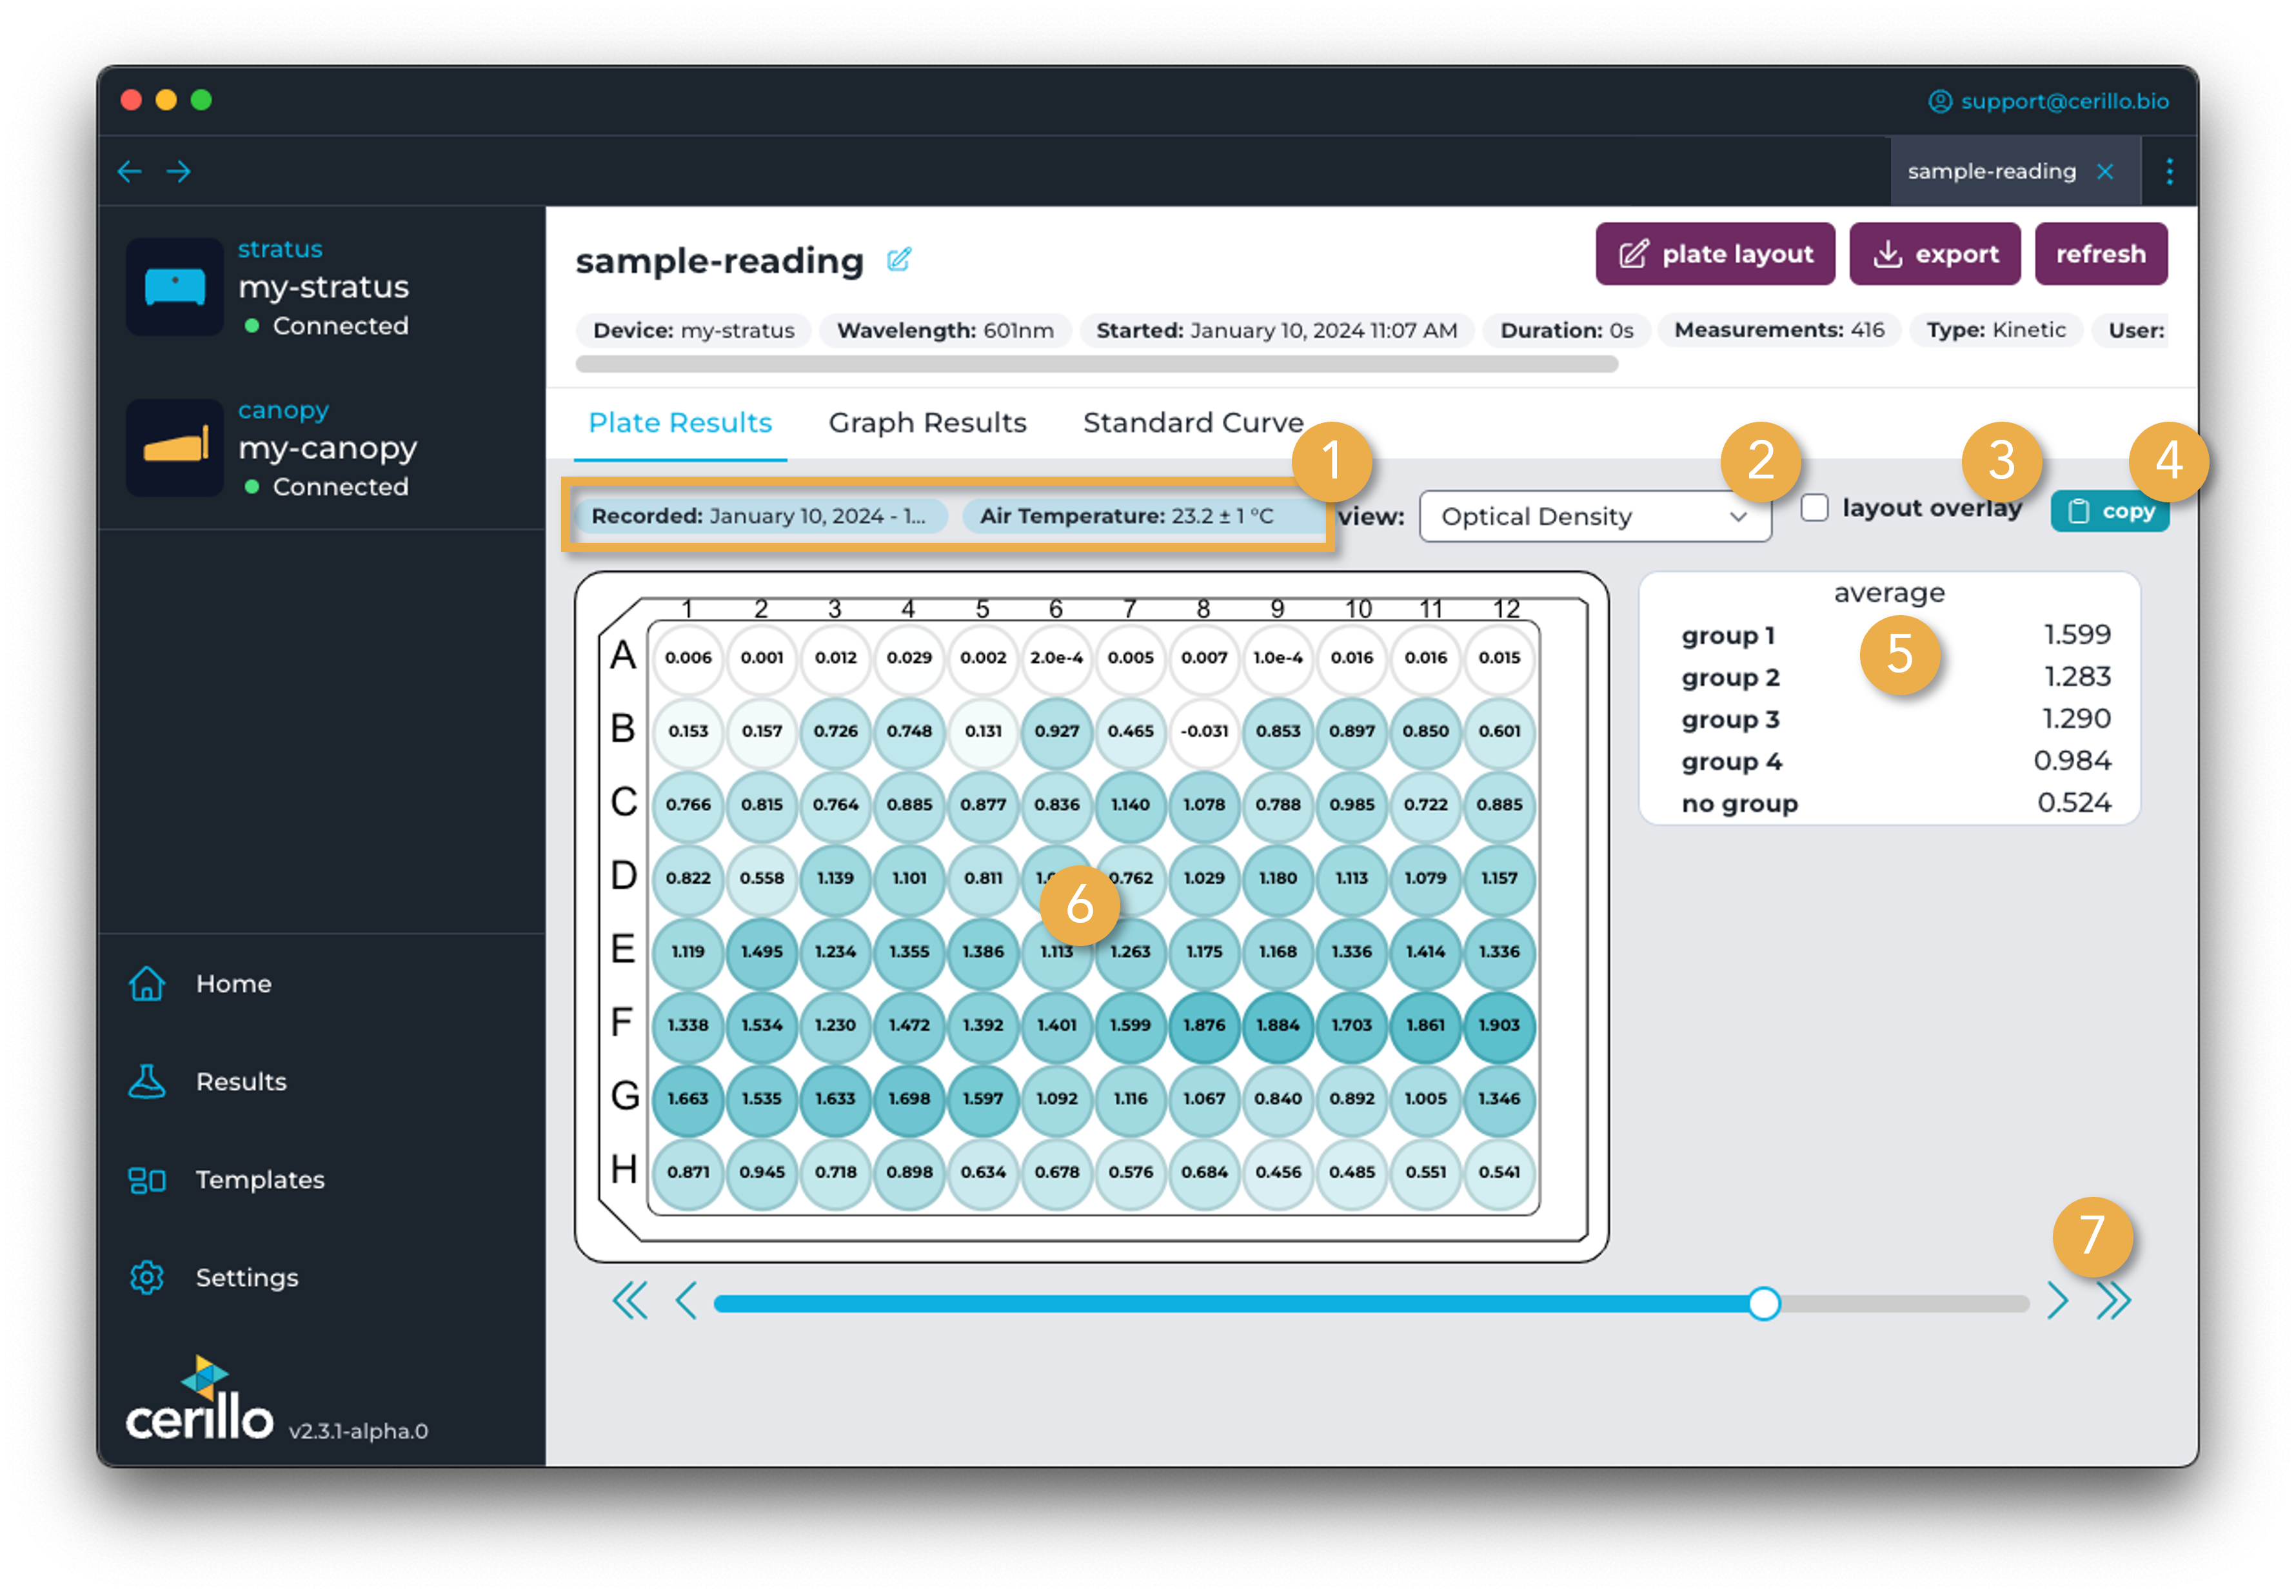
Plate Results will display a heatmap of the optical density of each well, with tools to navigate between different measurements, as seen in the image below.
Number |
Element |
Description |
|---|---|---|
1 |
Measurement Info |
Information about the specific measurement being viewed such as the temperature of the device at that time and the time the measurement was recorded. |
2 |
View Select |
Select between viewing optical density, concentration, and concentration x dilution factor. Concentration views only available for endpoints with standard curve information entered. |
3 |
Layout Overlay Toggle |
View plate with Layout Overlay displayed. |
4 |
Copy Button |
Copy measurement to clipboard for pasting into a spreadsheet program |
5 |
Plate Result Display |
Heatmap of the optical density of each well |
6 |
Group Averages |
Averages of groups from plate layout. |
7 |
Time Slider |
Click circle and drag to navigate between measurements in time. Click the single arrow to navigate forward or back one measurement in time and the double arrow to navigate to the first or most-recent measurement. The time slider will only appear for kinetic experiments with more than one measurement. |
For ongoing experiments, a Live button will display which you can click to view live results as they are measured.
Endpoint Experiment Plate Results
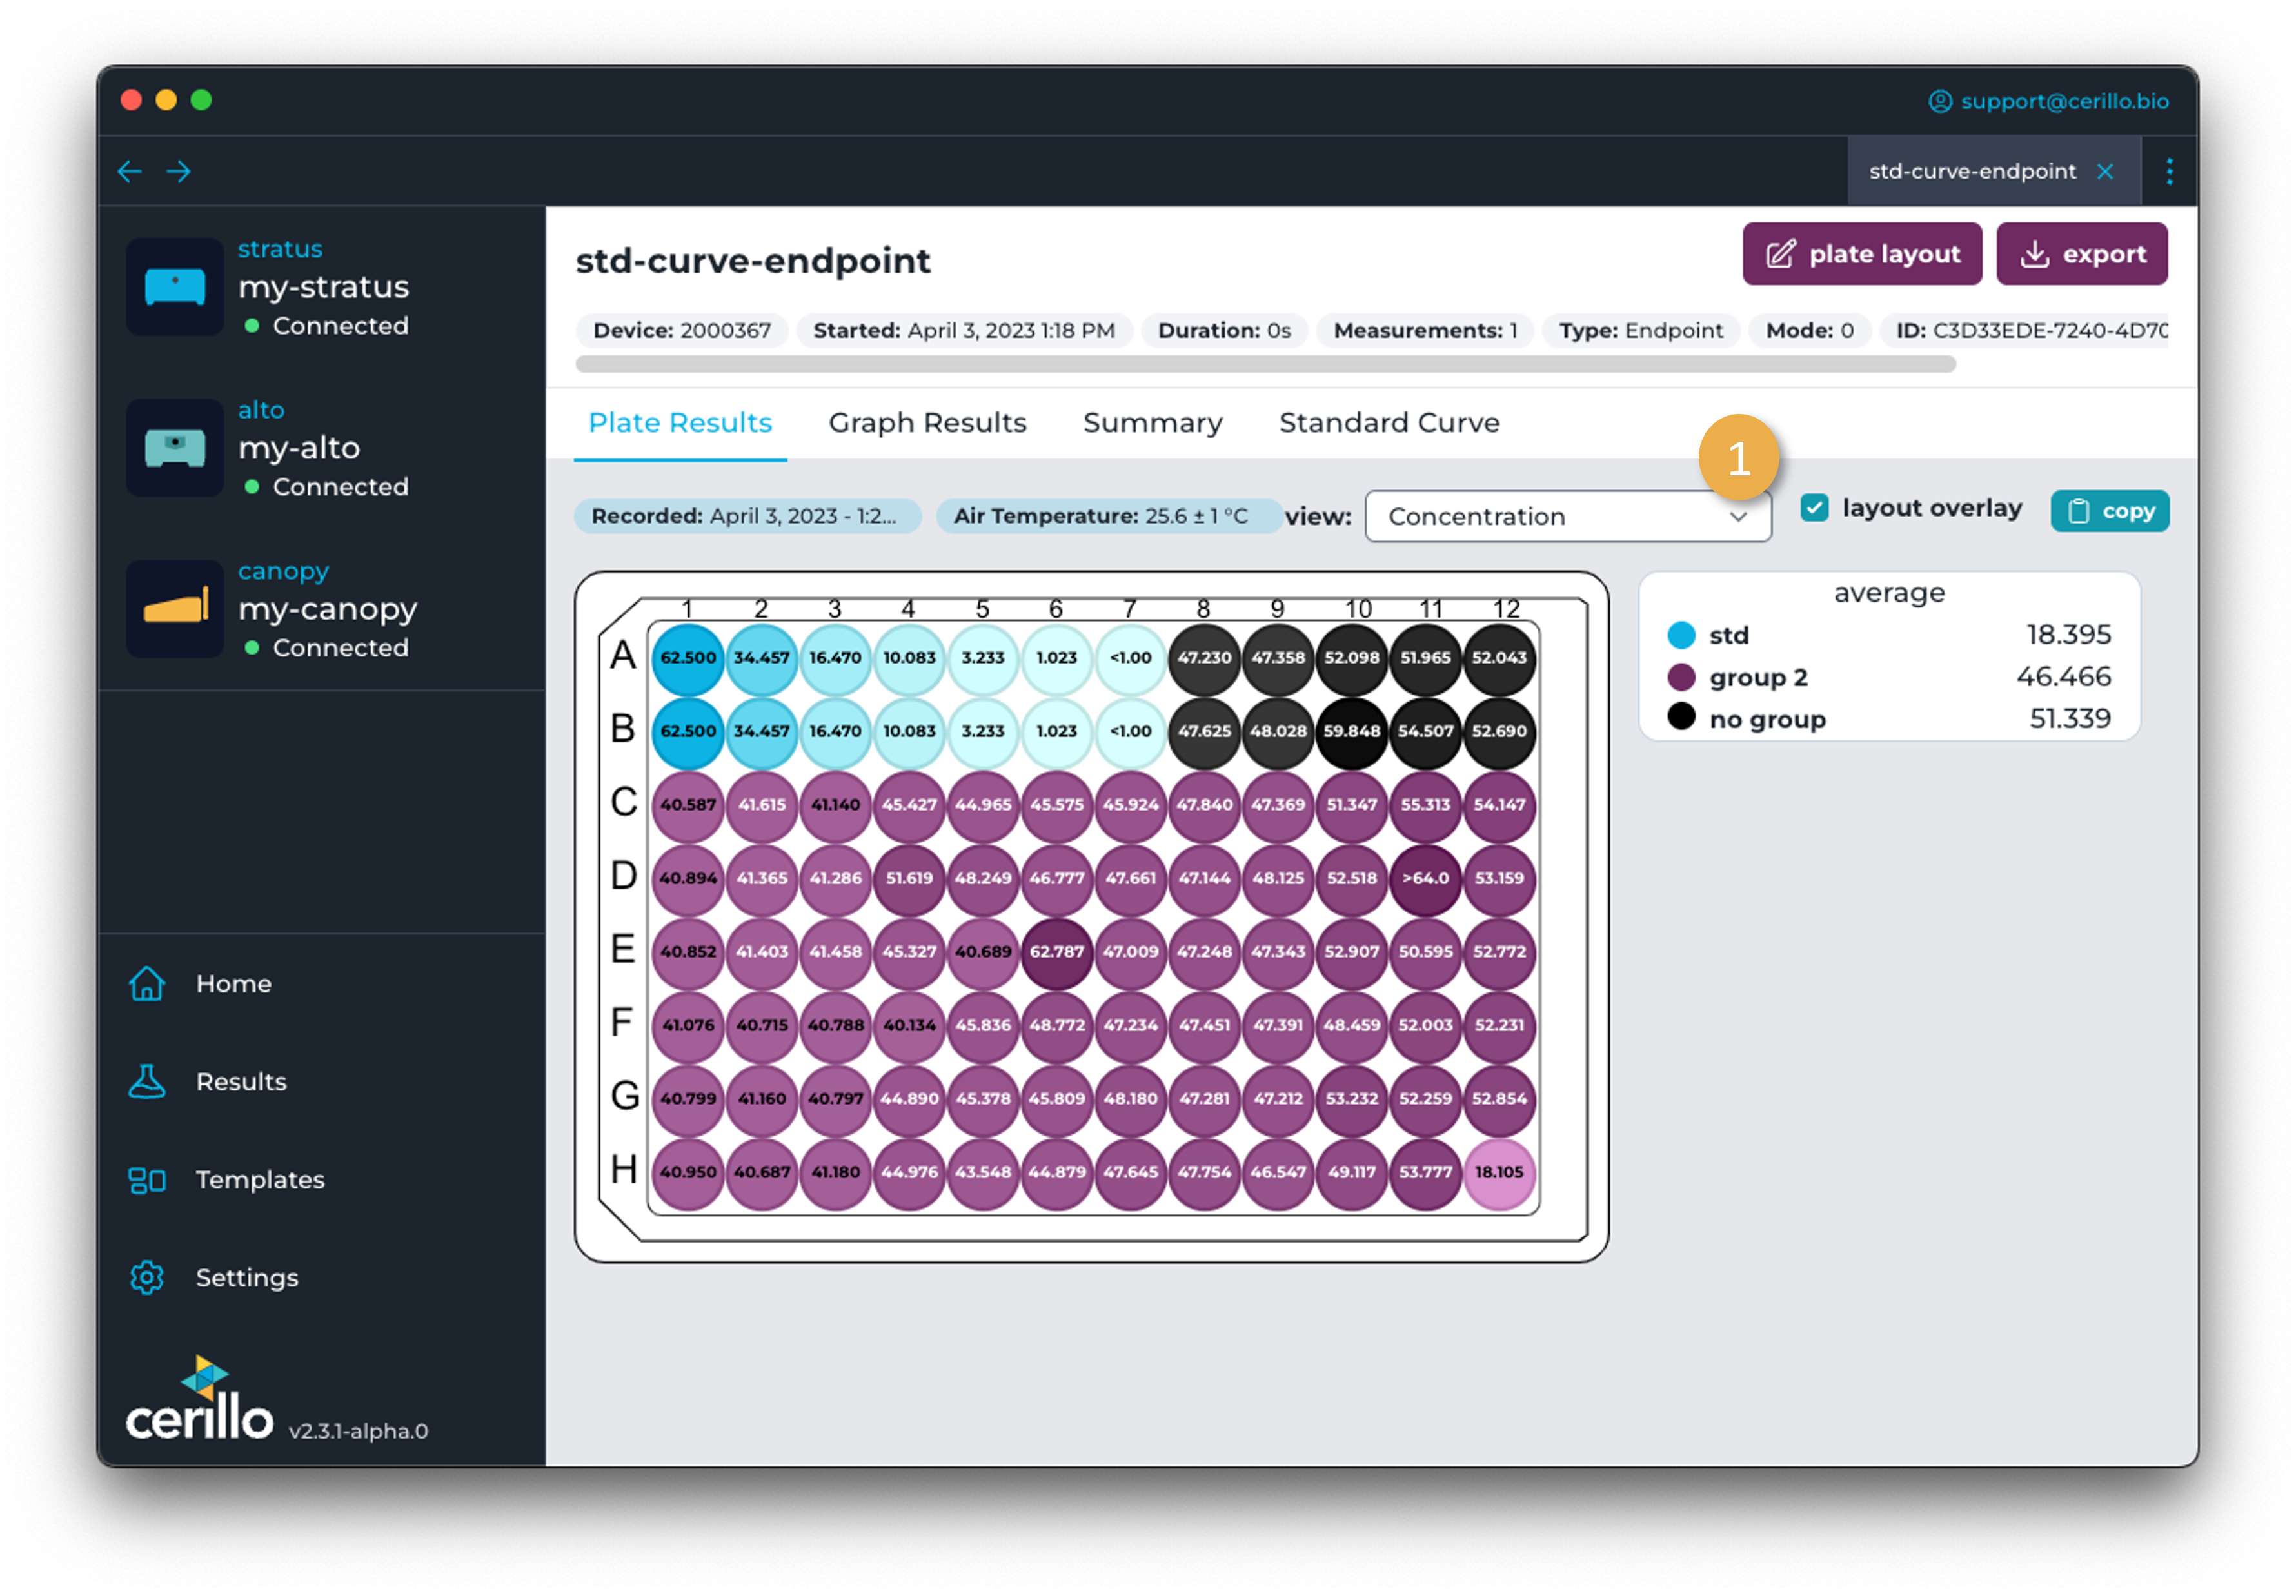 For endpoint experiments that have standard curve information entered in the Endpoint Plate Layout, concentration can be shown in the plate results in addition to optical density.
Layout Overlay
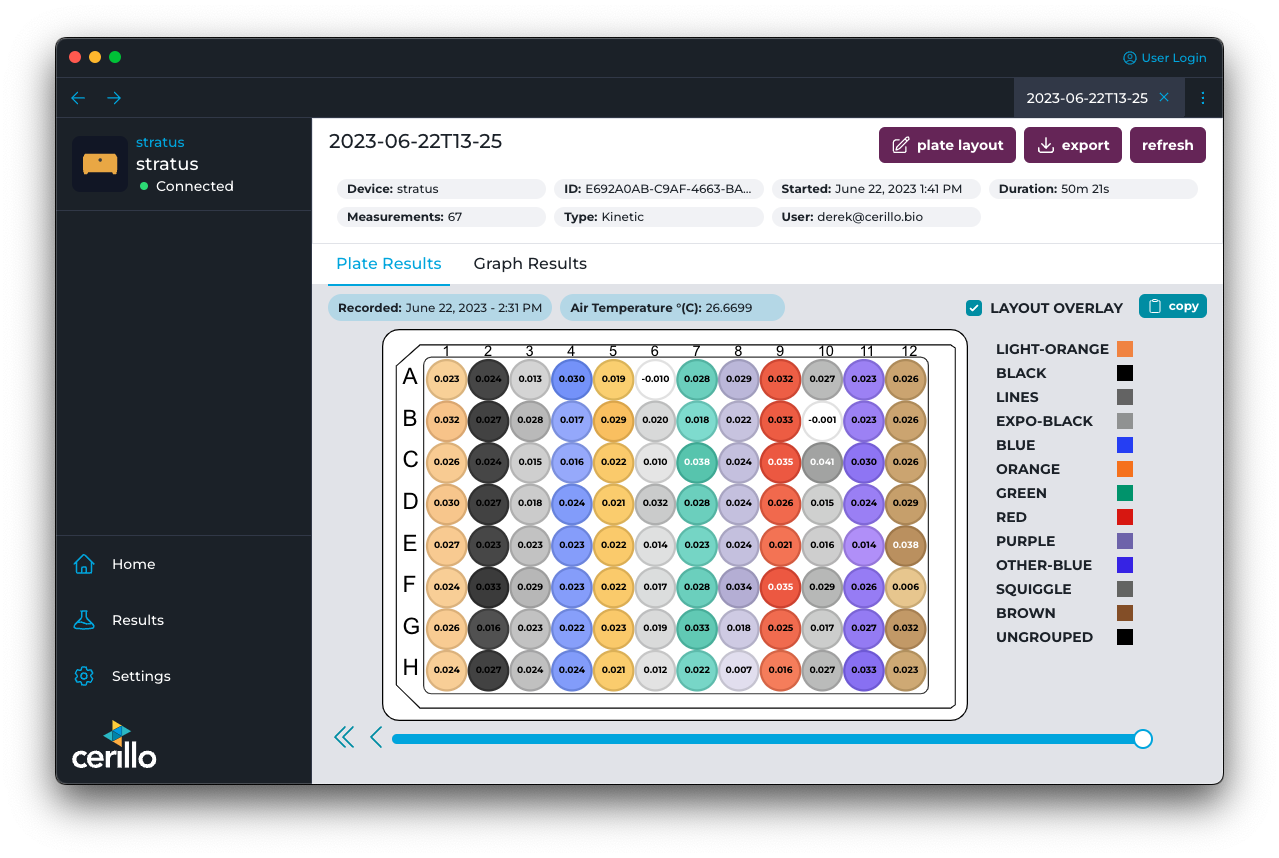 Displays plate layout groups for the plate. Colors are adjusted based on the optical density measurement.