Plate Layout
Plate information such as the type and layout can be input in this dialog. Plate layout information can be changed after the experiment is started, but plate type cannot be changed after an experiment is started with certain exceptions. See Plate Mapping for details on those exceptions.
Note
While plate layout information can be altered after starting an experiment there are some caveats to that workflow. Plate layout information entered on experiment set up is saved on the device itself. However, any changes made to the plate layout made AFTER the experiment has started will only propagate on the computer where the change was made. If the device is connected to a different computer, the original plate layout entered here will be displayed in experiment results, regardless of changes made on separate computers.
General controls
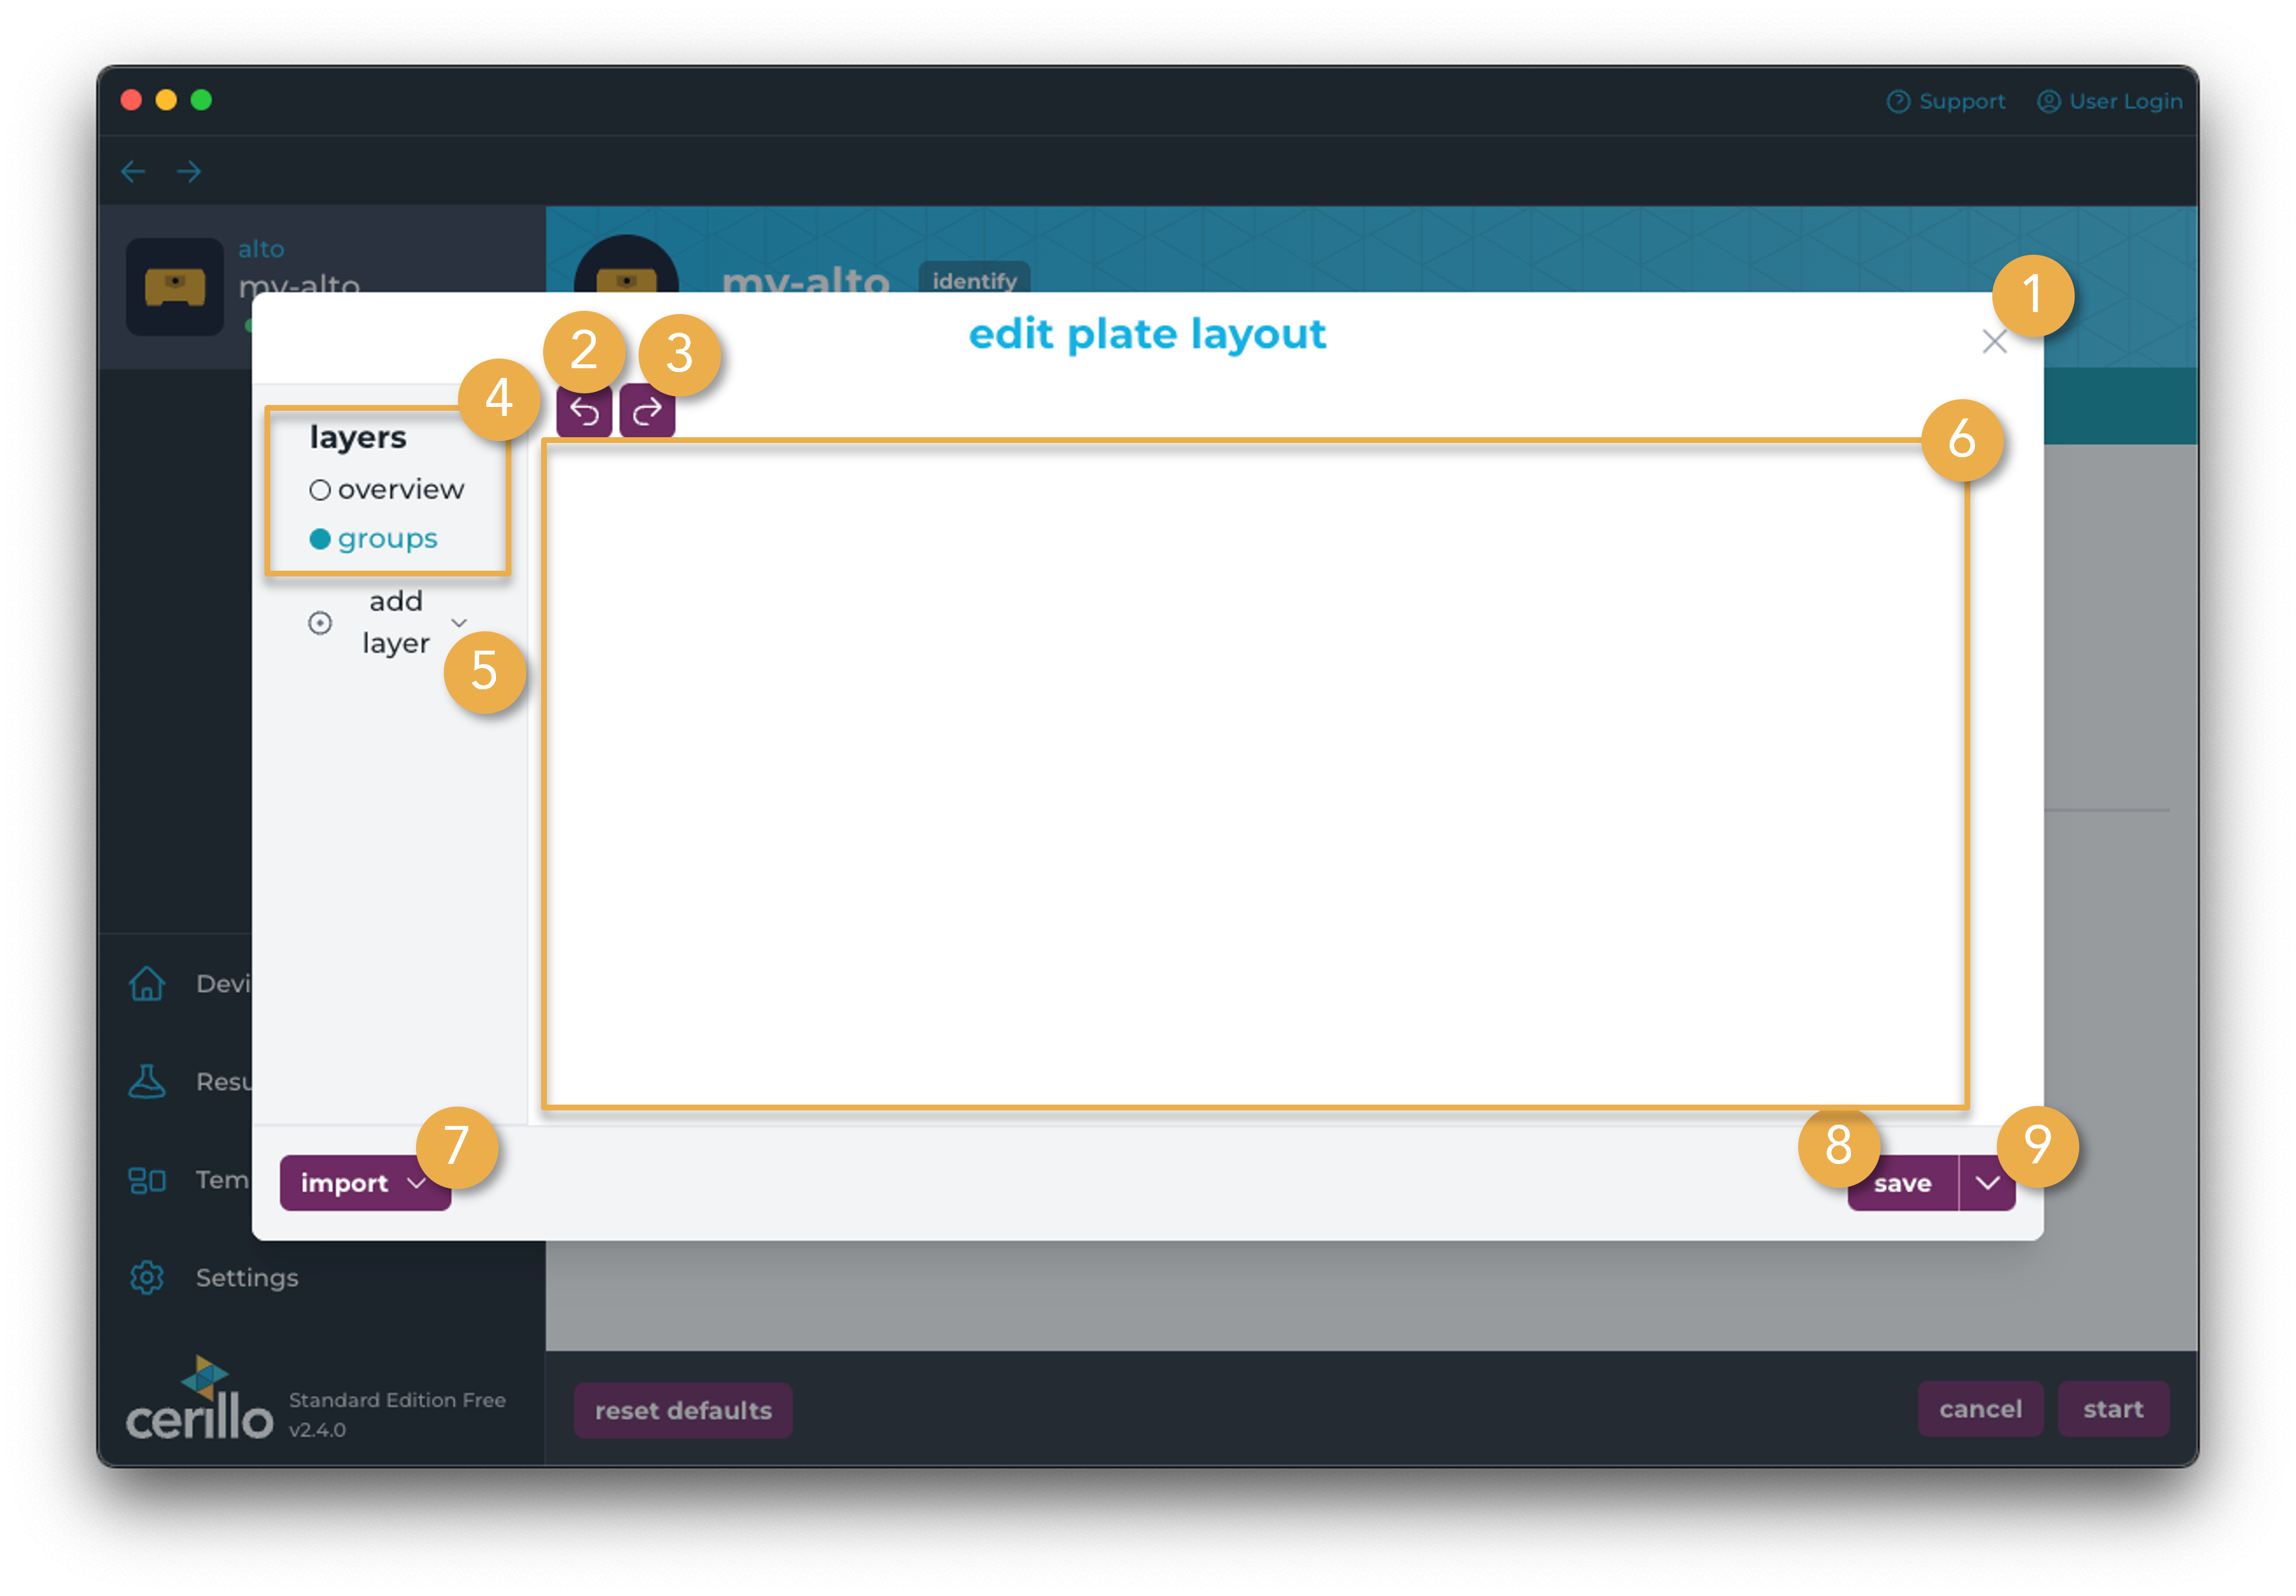
Plate layout information is split into layers, to more easily control various aspects of your plate. To more easily recall recent changes made to your layout, history of the layout is saved while the dialog is open and changes can be undone and redone with the Undo (2) and Redo (3) buttons or with “Ctrl+z” and “Ctrl+y” keyboard shortcuts. See annotated screenshot below for general controls and history.
Number |
Element |
Description |
|---|---|---|
1 |
Close |
Close button. On close, layout changes will be auto-saved. Once closed or saved, history will be cleared. |
2 |
Layer Navigation |
Click on the layer name to navigate to that layer to make changes to it. |
3 |
Undo |
“Ctrl+z” shortcut. Undoes most recent change made to plate layout. History is cleared once dialog is closed, and undo |
4 |
Redo |
“Ctrl+y” shortcut. Redoes most recent change undone to plate layout. |
5 |
Add Layer |
Dropdown to add Optional Layers. |
6 |
Layer Controls |
Controls for modifying the current layer. |
7 |
Import |
Import dropdown that allows you to import a plate layout from a |
8 |
Save |
Save the plate layout and close the dialog. |
9 |
Save Dropdown |
Export the plate layout as a |
Note
Layer navigation was moved to a left sidebar instead of across the top of the editor in Labrador v2.4.0. Besides that aesthetic change the screenshots from previous Labrador versions are still applicable.
Overview Layer
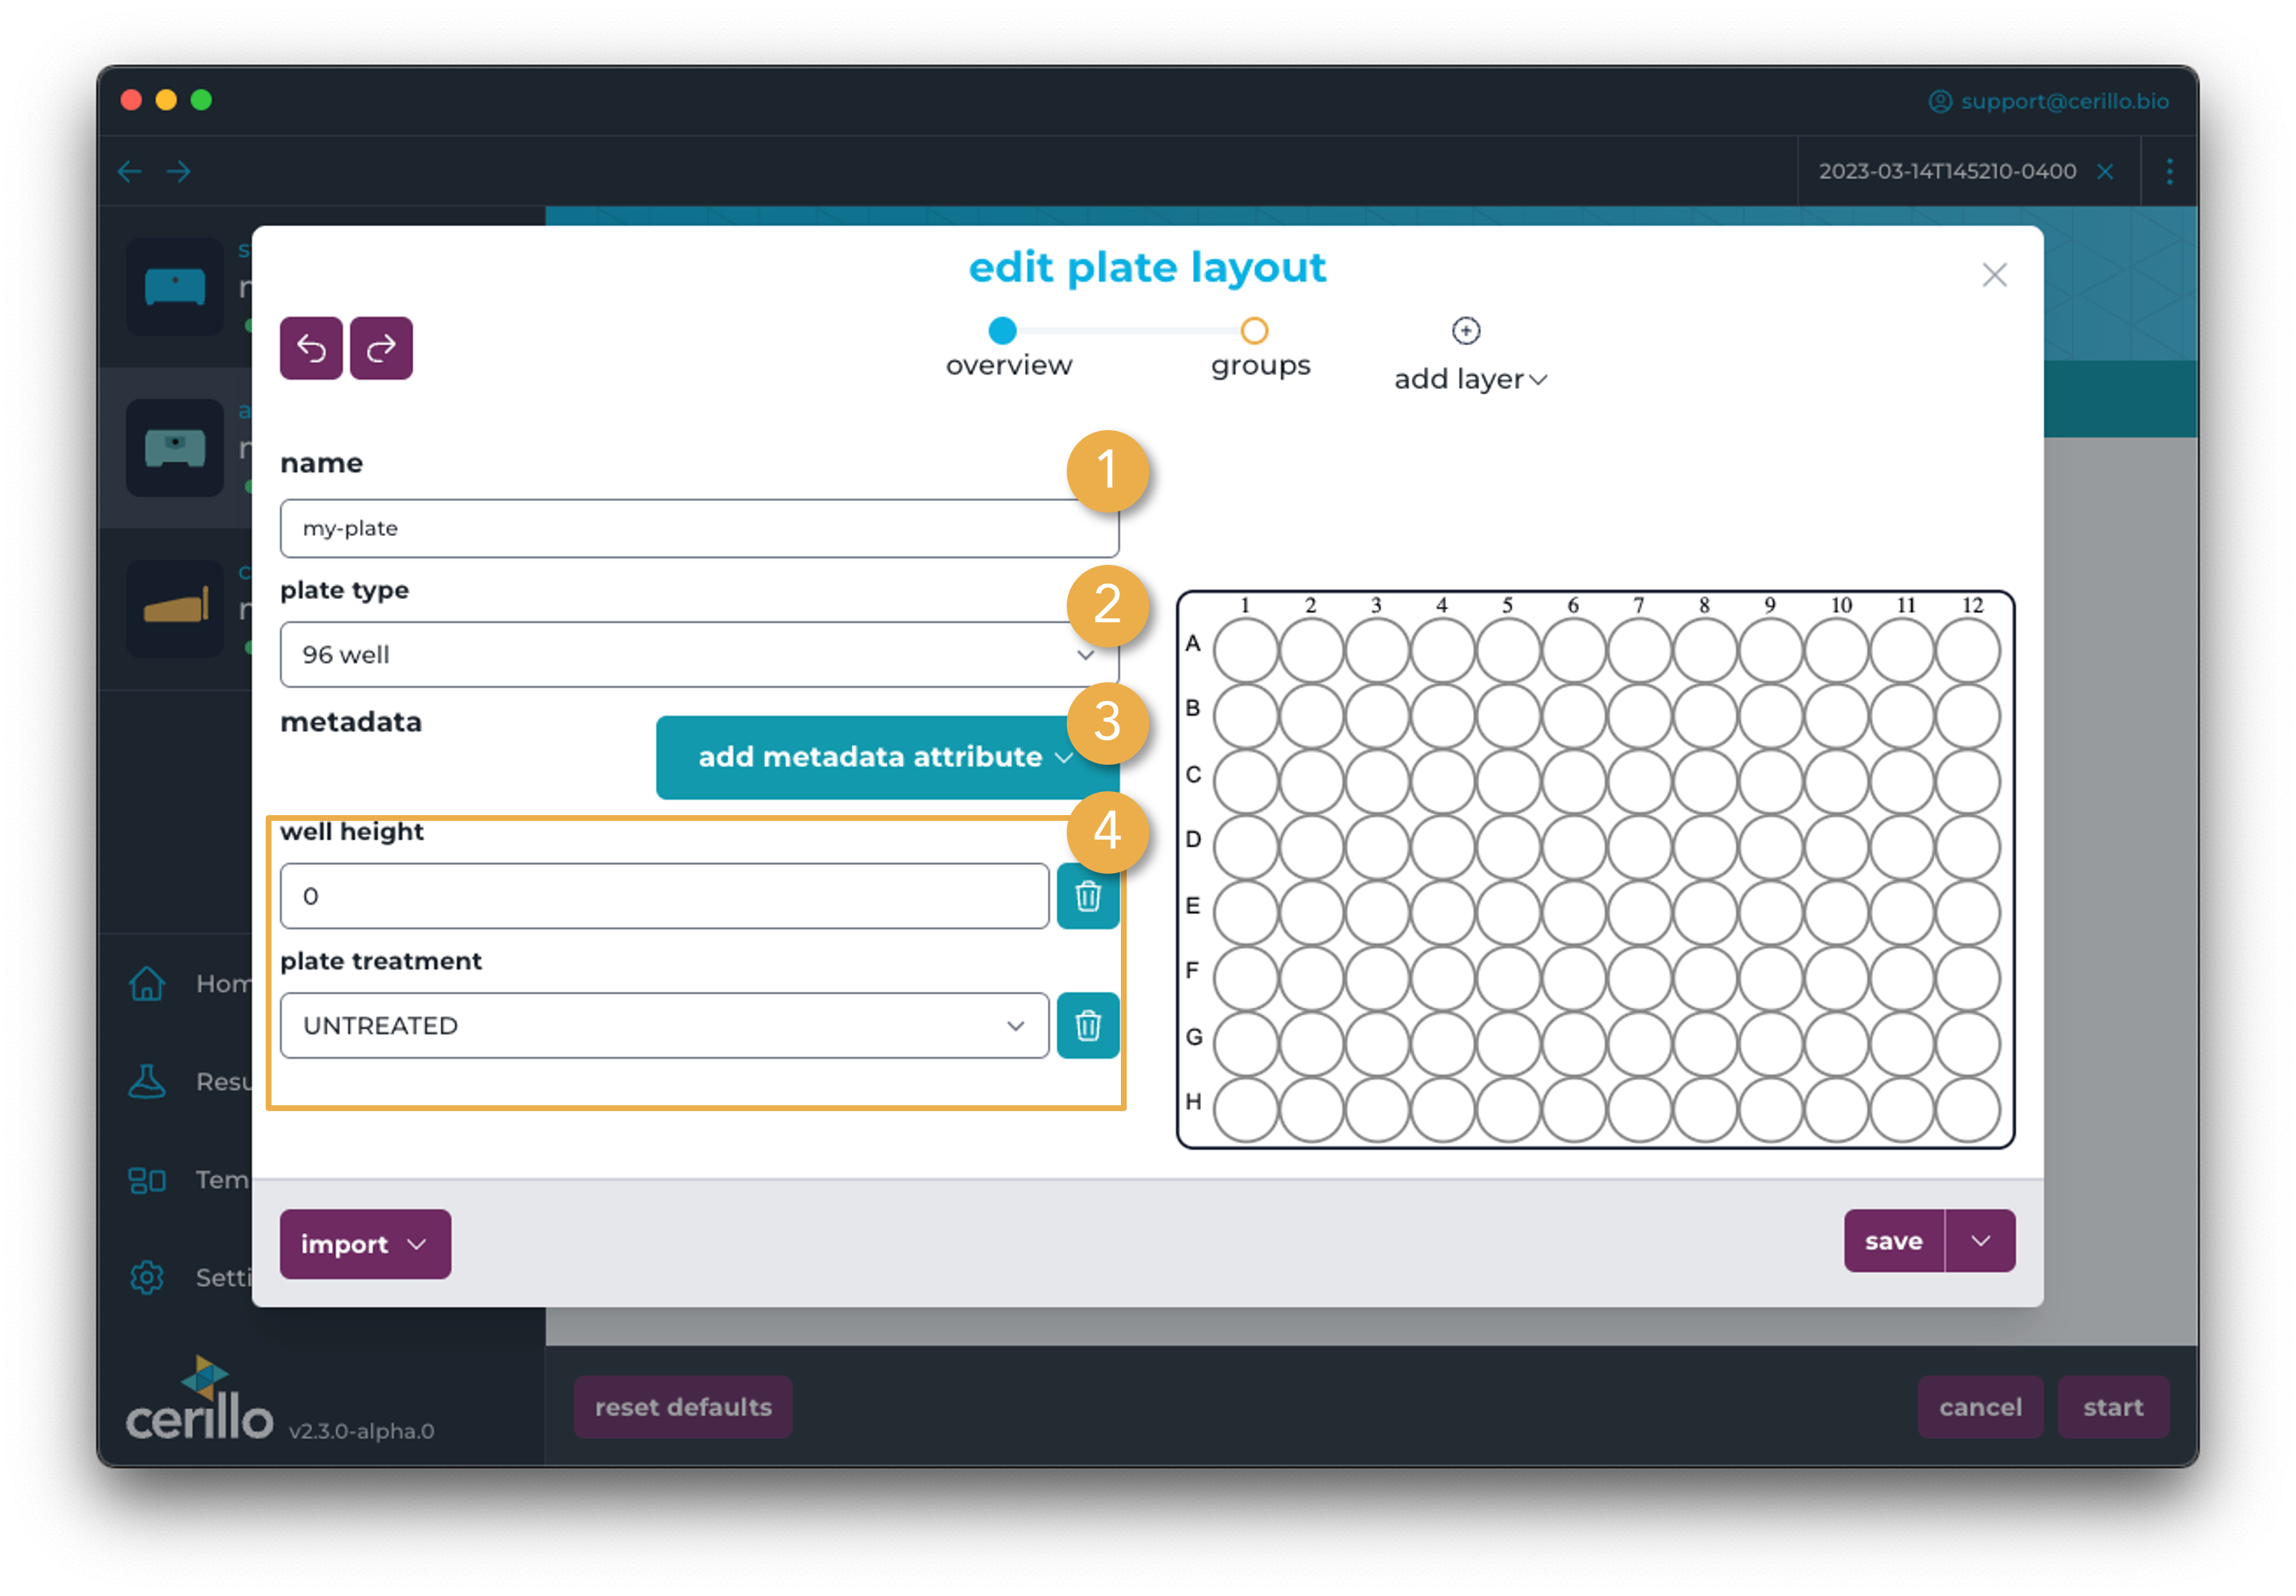
Overview layer allows you to update information and metadata about the overall plate. Additional plate metadata can be added with the add metadata attribute dropdown. Metadata added here does not affect data visualization or device behavior. It is mainly useful as a storage place for certain metadata that can be referenced later.
Number |
Element |
Description |
|---|---|---|
1 |
Plate Layout Name Input |
Update the name of the plate layout. Mostly useful if this the plate layout is saved as a template. screen |
2 |
Plate Type Select |
Select the type of plate. Changing plate type can affect other layers, such as well assignments being remove from wells that don’t exist in the new plate type. When the Custom plate type is selected, the number of rows and columns of the plate can be manually entered. Custom plate types cannot be used by cerillo devices, but can be used for imported data. |
3 |
Plate Metadata Controls |
Modify or remove added metadata attributes. |
4 |
Add Metadata Attribute Dropdown |
Add metadata attribute for the plate. Only certain metadata attributes are supported. |
Note
Custom plate types can be used for imported data, but cannot be used by Cerillo plate readers. This is because Cerillo plate readers use stationary emitter and detectors so they cannot measure arbitrary points on a plate. 96-well plates are the largest number of wells Cerillo plate readers can measure.
Groups Layer
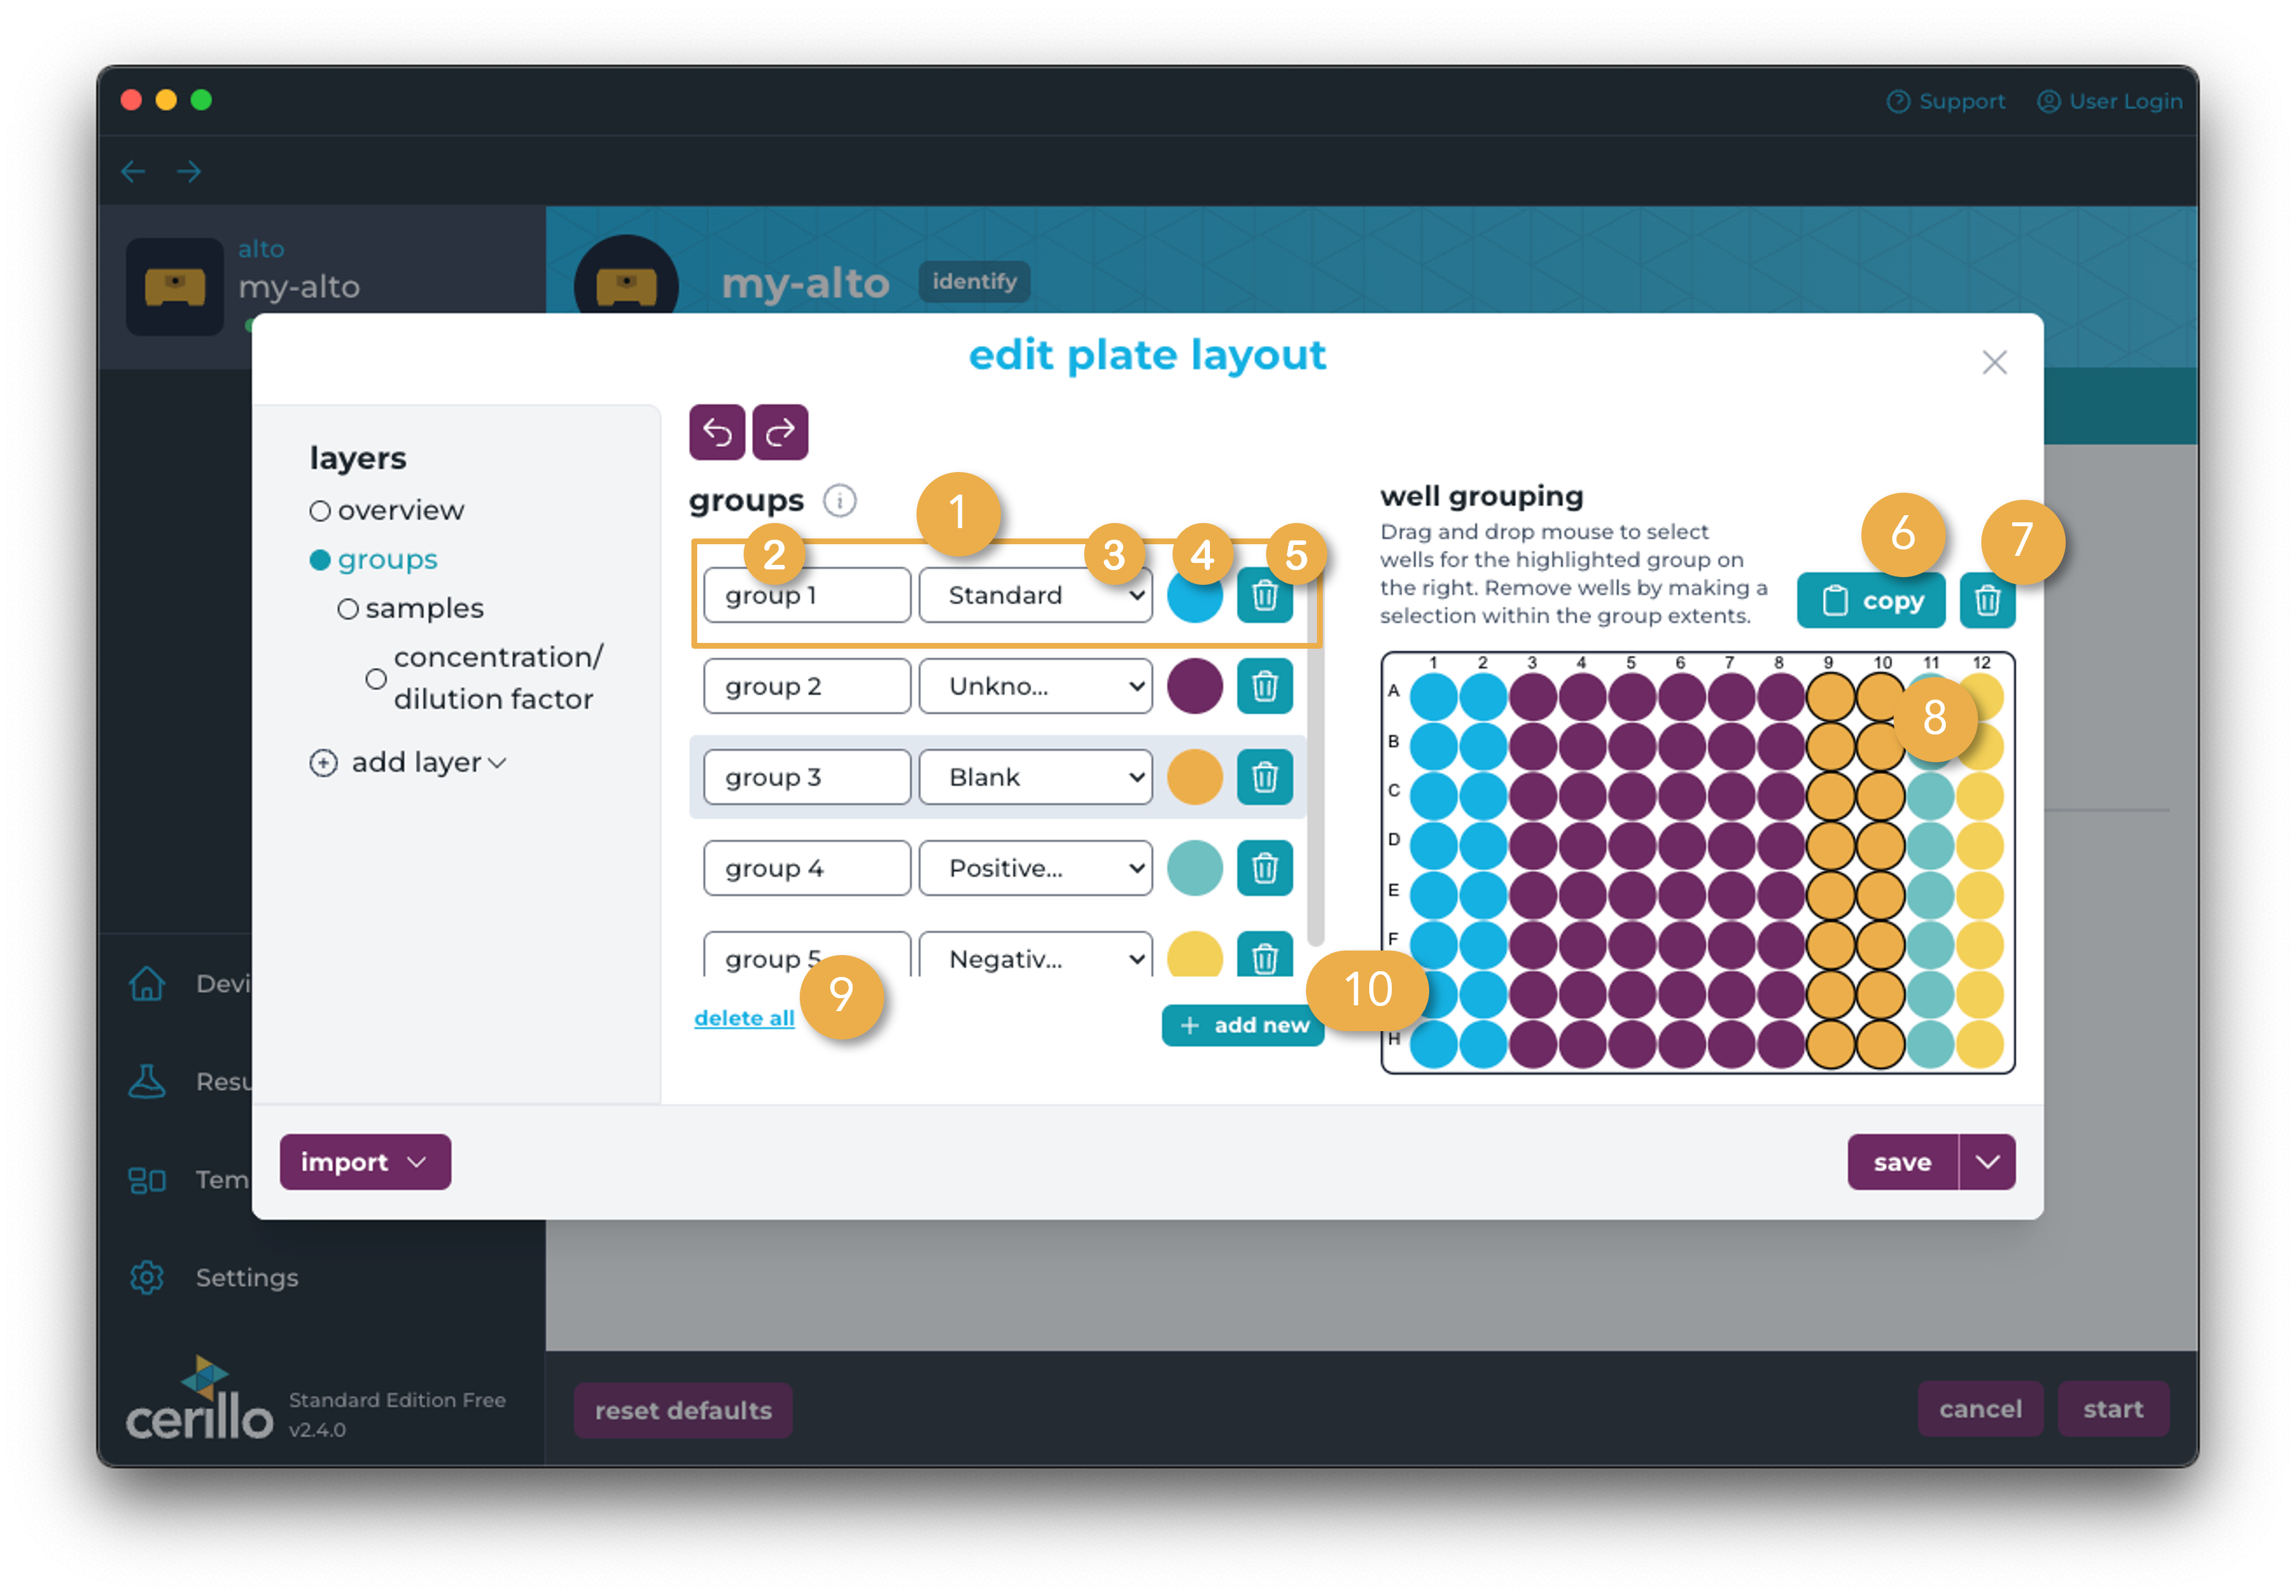
Add groups and assign wells to those groups. Groups are the highest-level of aggregating wells in a plate layout. Typically this would be a strain of bacteria or set of reagents. Group averages will be shown in plate and graph results. If needed, groups can be broken down further into samples which represent replicates of the same concentration/dilution factor within a group. Wells are assigned to a group by drag-n-drop controls on the Plate Representation (8 below). Selections made will be added or removed from the currently selected group highlighted in the group list. Making a selection over wells already assigned to the group will remove them from that group. To quickly add many groups, you can use the “Ctrl+N” shortcut to add a new group.
Number |
Element |
Description |
|---|---|---|
1 |
Group Select Toggle |
Click within this section to “select” a group in order to add additional well assignments to this group using the workflow described for Plate Representation (8). The selected group will highlight the wells assigned to the group on the plate by showing them with a black border. |
2 |
Group Name Input |
Update the name of the group. This could be used to track blank wells, different concentrations of samples, or whatever suites your needs! |
3 |
Group Type Select |
Choose between Unknown for samples with unknown concentrations, Standard for samples with known concentration and Blank for blank samples. |
4 |
Group Color Selector |
Click here to update the color of the group. |
5 |
Delete Group |
Click here to delete this specific group and all associated well assignments from the Plate Representation. |
6 |
Copy Layout |
Copies groups in comma-separated format to paste into spreadsheet programs. intact. |
7 |
Clear Grouping |
Removes all wells assigned to groups. Keeps group names and colors intact. |
8 |
Plate Representation |
Alterations to well assignments are made here. When a group is selected, drag and drop mouse to assign multiple wells to that group or click mouse to assign individual wells. Making a selection over wells already assigned to the group will remove them from that group. |
9 |
Delete All Groups Button |
Click here to delete all groups and all well assignments from the Plate Representation. Requires confirmation prior to execution. |
10 |
Add New Group Button |
“Ctrl+n” shortcut. Click here to add a new group to the list of groups. The new group will automatically be selected for well assignment additions in the Plate Representation. |
Optional Layers
Excluded Wells Layer
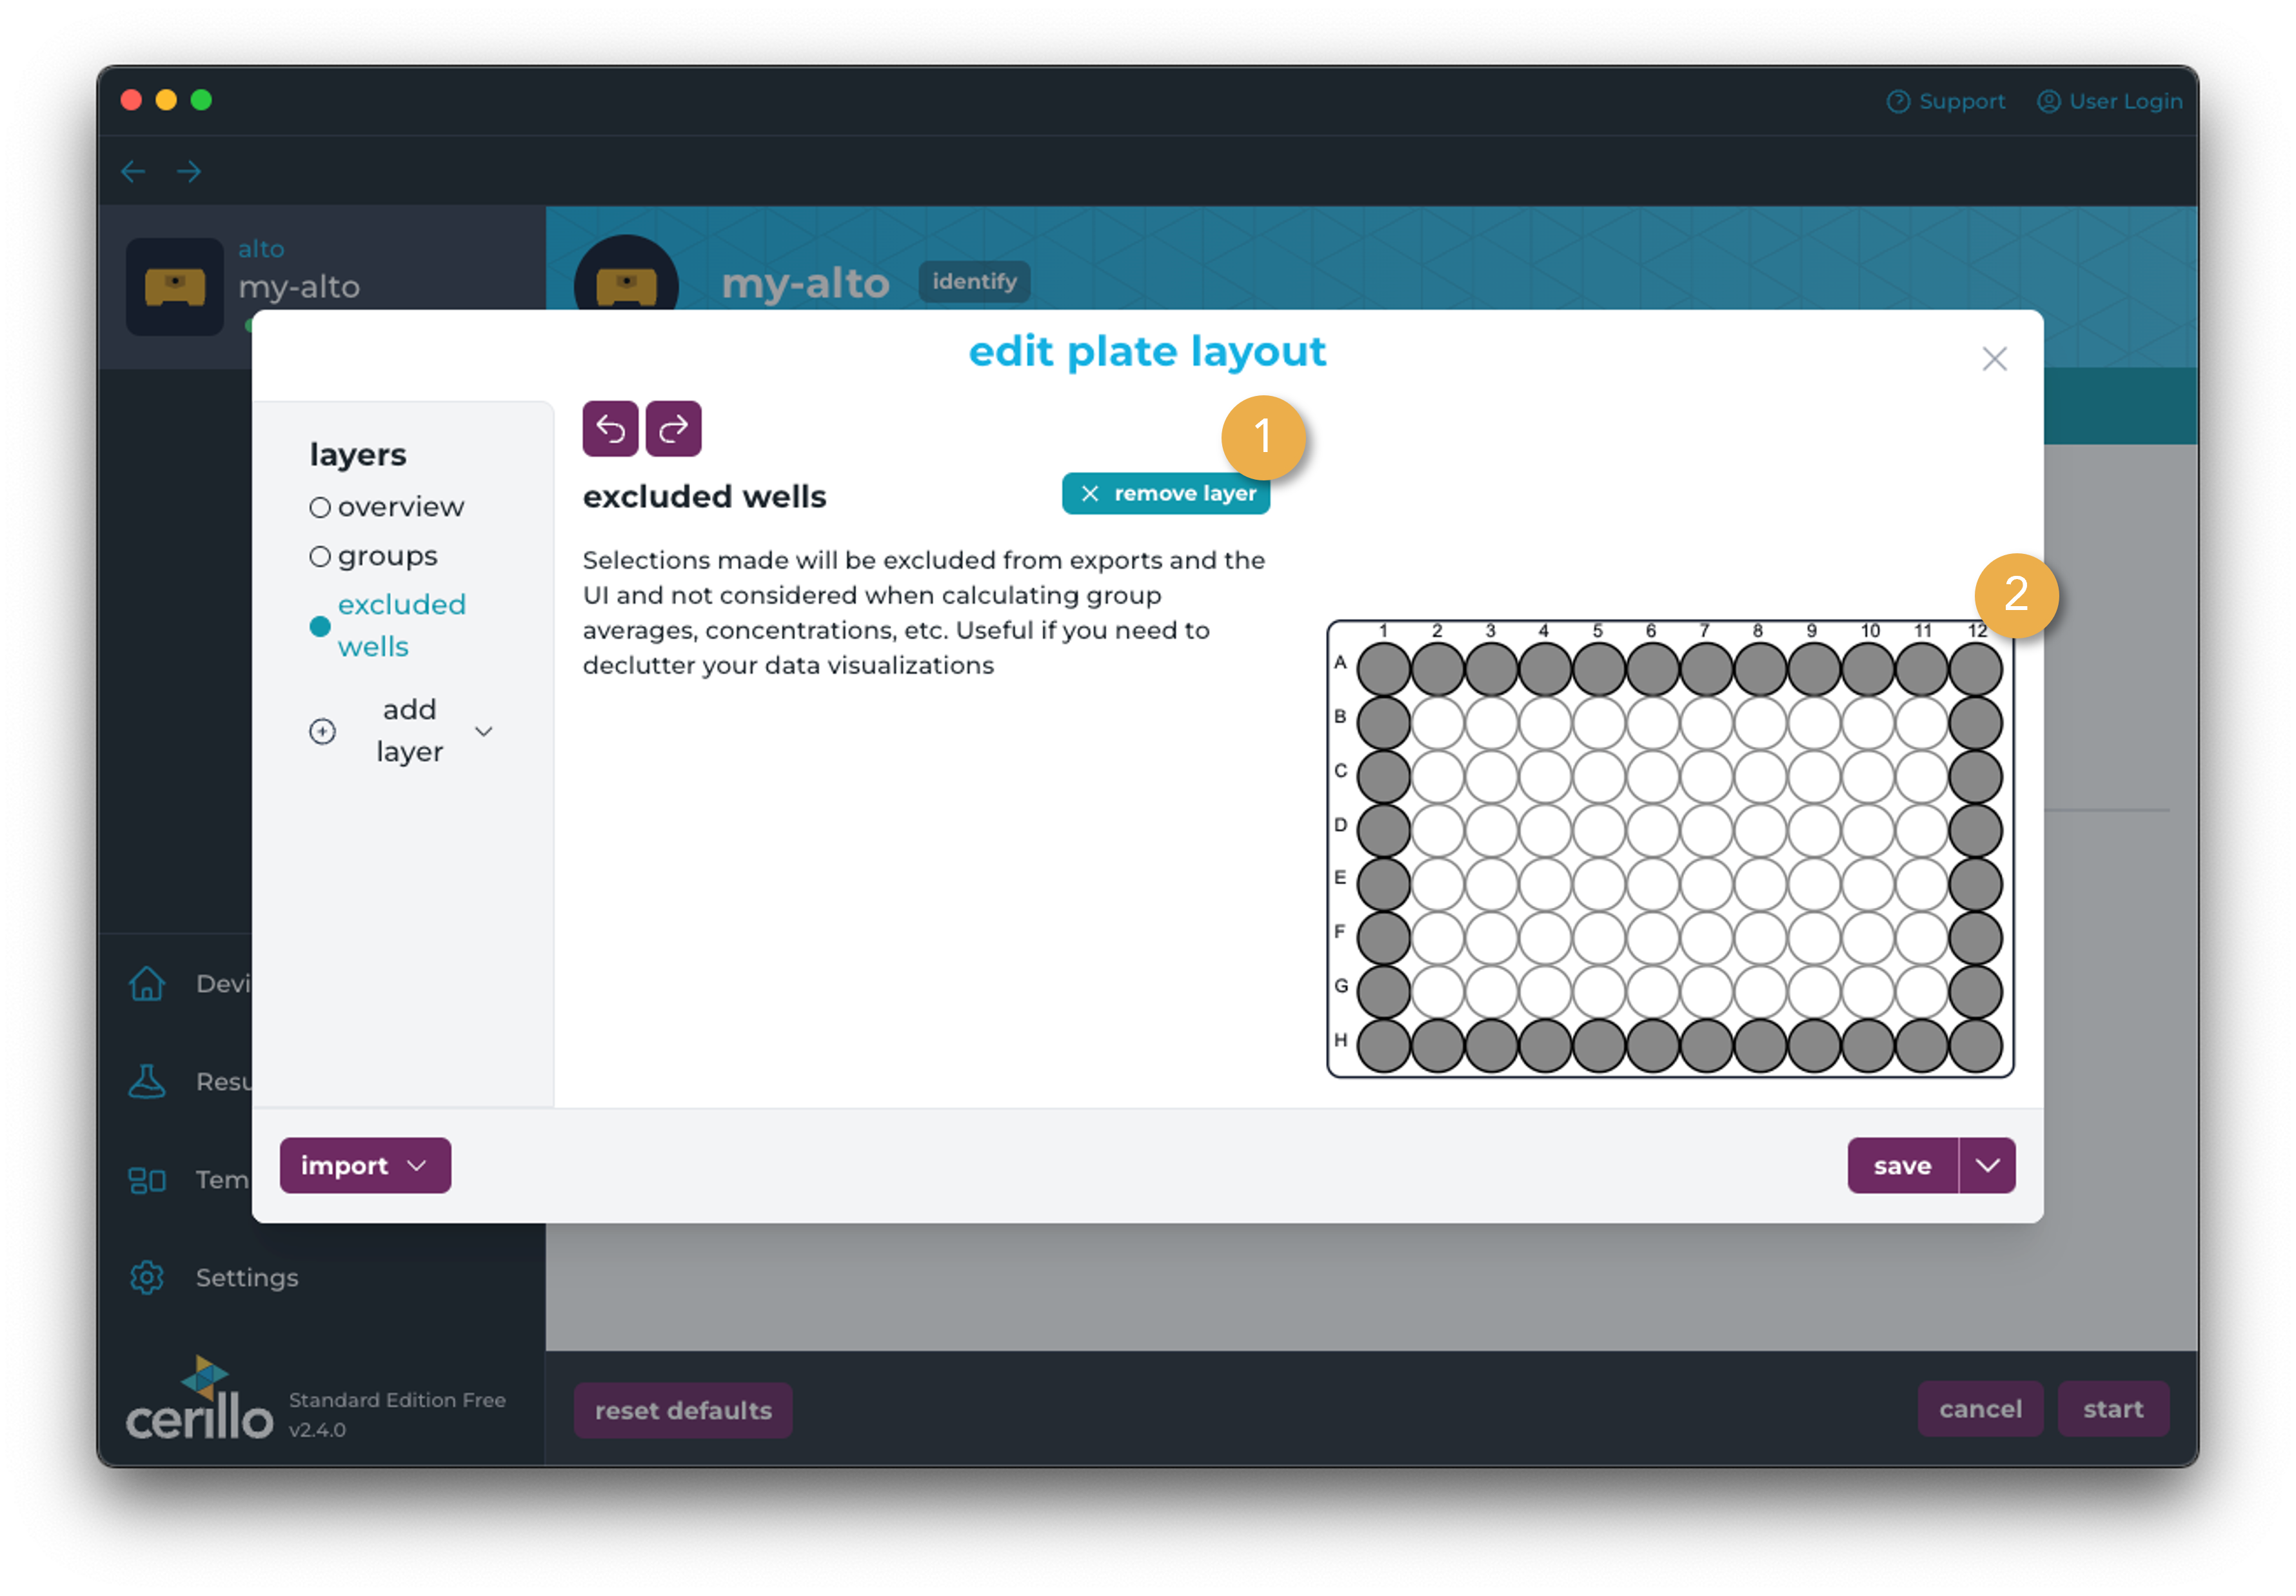
The excluded wells layer will exclude wells from all data visualization and analysis. Add wells to the set of excluded wells with drag-n-drop controls in the plate representation.
Number |
Element |
Description |
|---|---|---|
1 |
Remove Layer |
Remove the excluded wells layer. Will show all wells in data visualization and analysis if removed. |
2 |
Plate Representation |
Drag and drop cursor or click to add wells to the set of excluded wells. If all selections are already part of set of excluded wells, they will be removed from set. |
Layers Belonging to Groups
Certain layers are children of the groups. For example, samples are sub-groups within a group that represent similar concentrations/dilutions of reagents (or replicates) within that group.
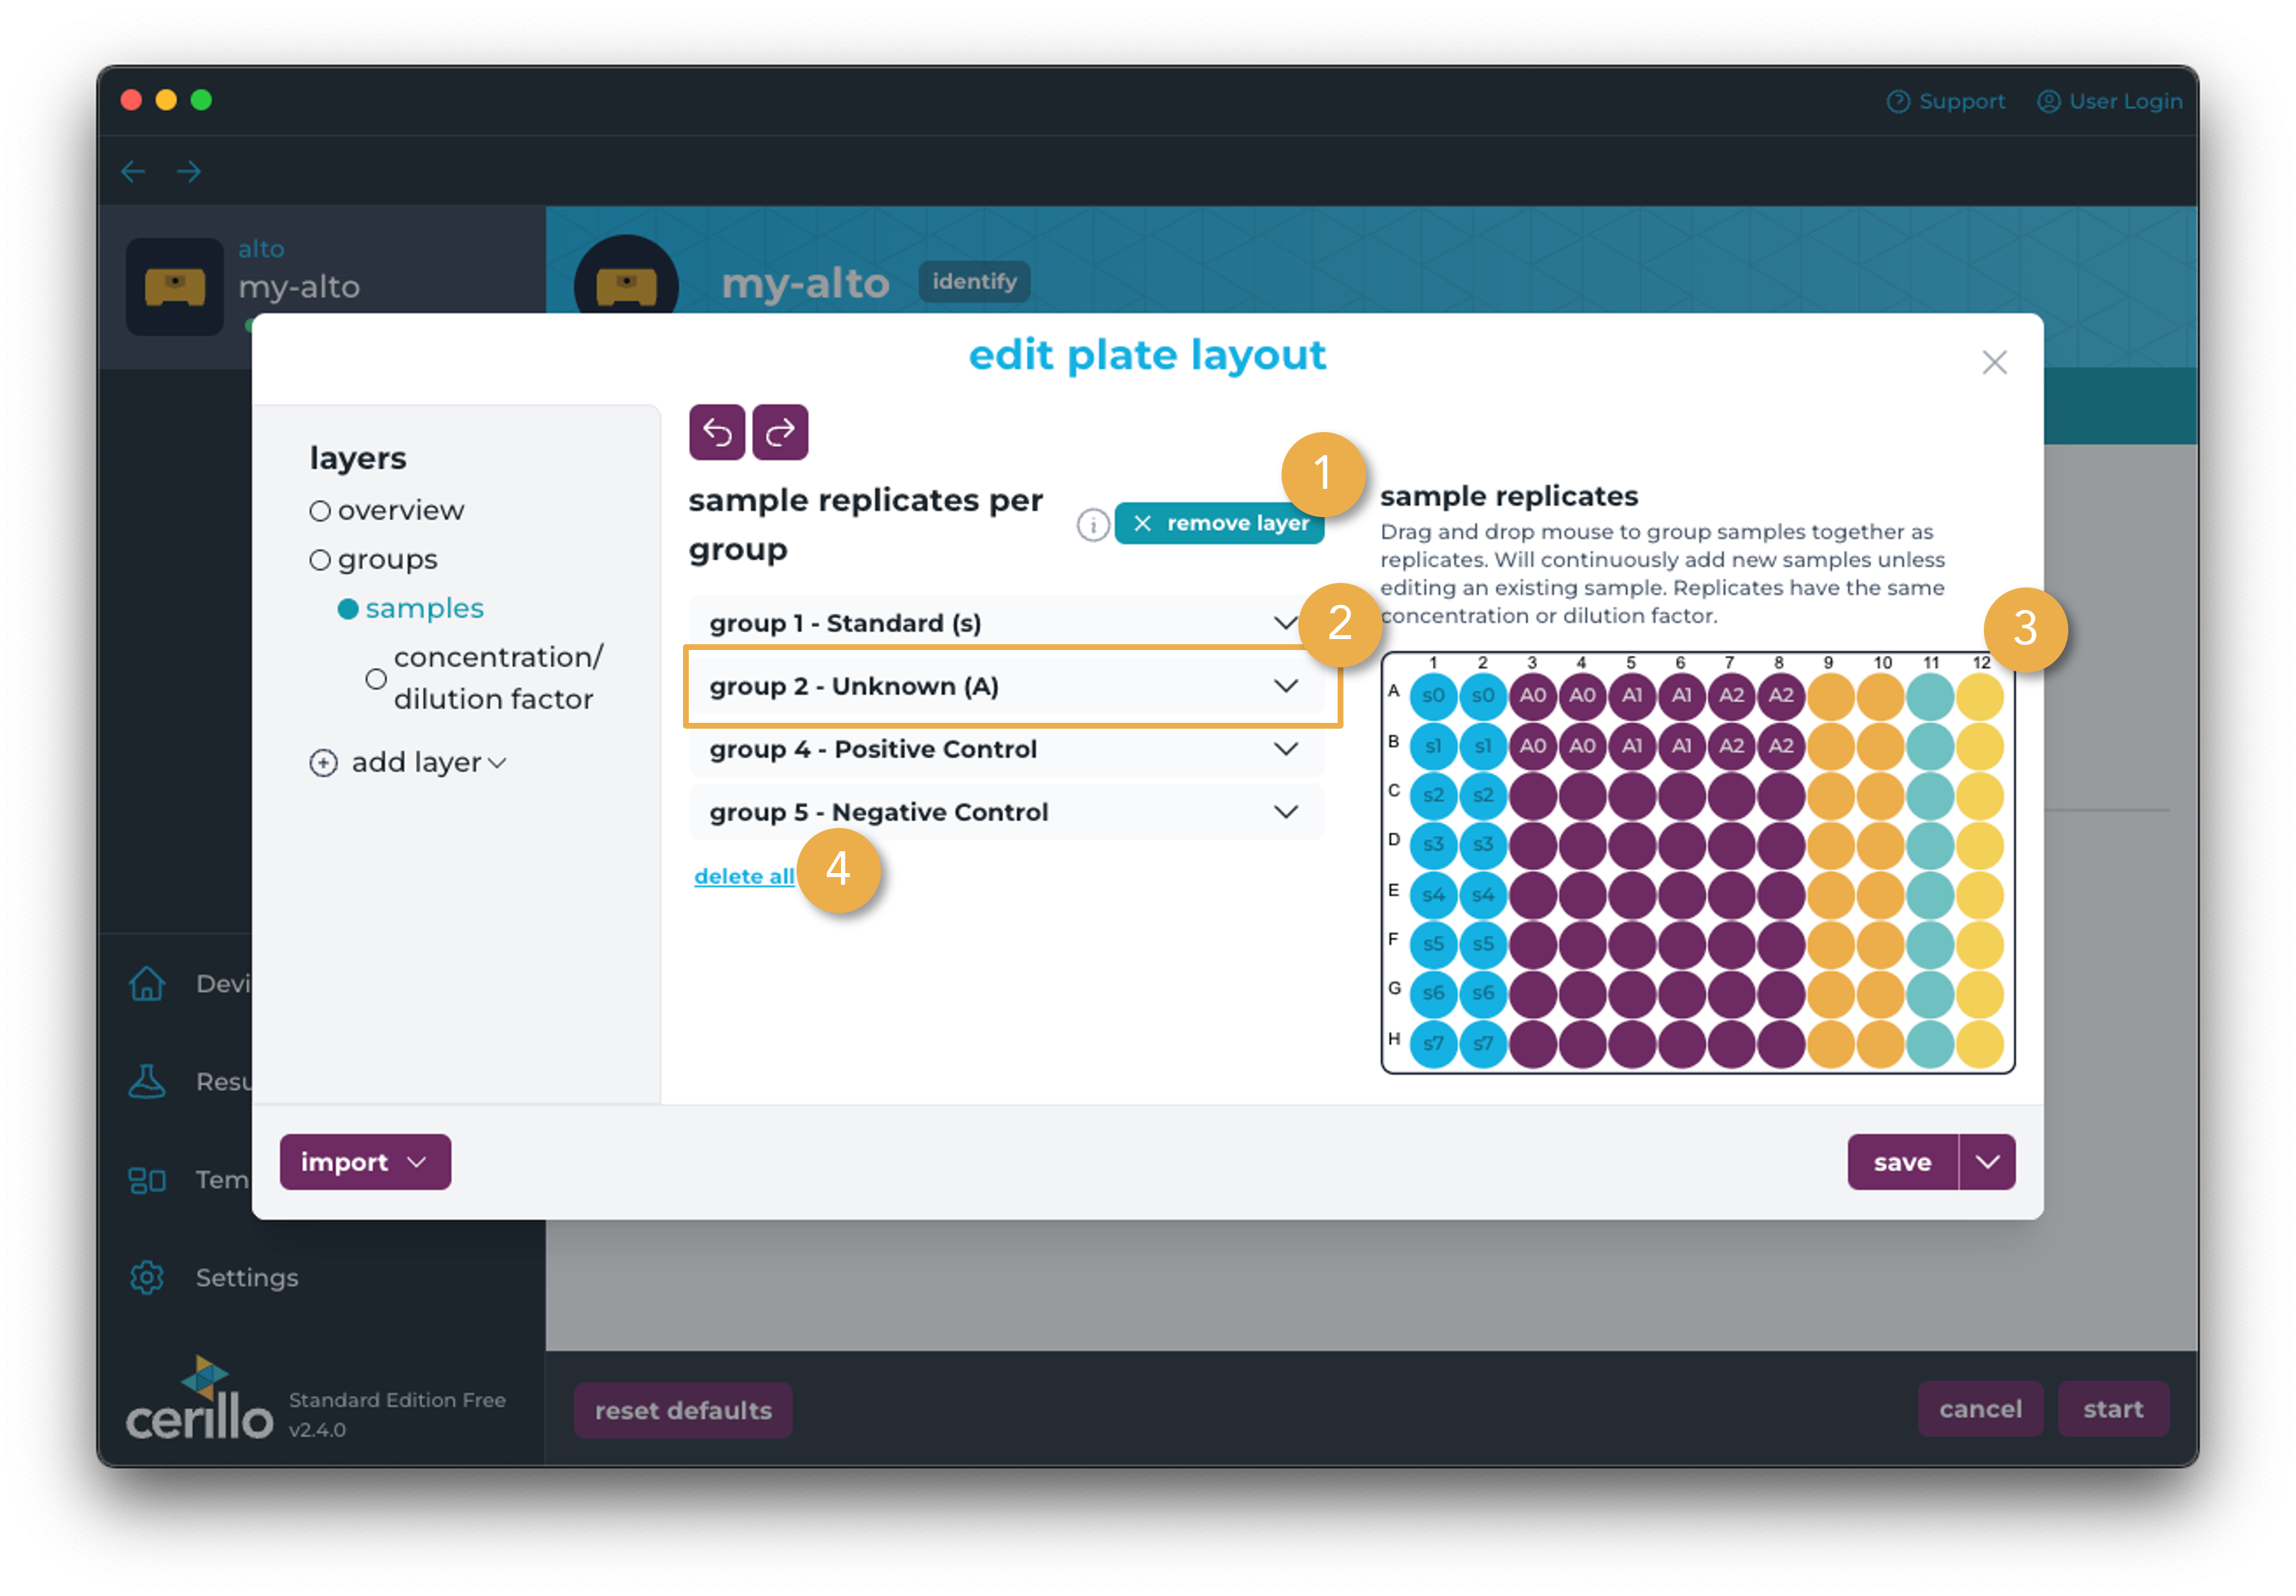
Samples + Concentration/Dilution Factor Layer
The samples layer is used for assigning samples to your groups. Samples represent replicates within an experiment, unless you are choosing to group replicate with groups. Either approach is fine, but for generating a Standard Curve, replicates must be added as samples for the standard group. The samples layer displays a list of groups on the left. Clicking on a group will open the accordion to show the samples for that group. Assigning wells to samples works slightly differently from assigning wells to groups. To streamline adding many samples at a time, you can drag and drop your cursor multiple times to quickly create multiple samples for a group. Whenever the currently active sample is unassigned samples this will be the behavior of drag and drop controls. If a specific sample is selected for editing, then the typical drag and drop controls are used to add or remove wells from that specific sample.
Video of assigning wells to samples across different groups.
Number |
Element |
Description |
|---|---|---|
1 |
Remove Layer |
Remove the samples and concentration/dilution factor layers. These layers are linked to each other. All sample information will be erased if the layer is removed. If removed by accident, use the undo button to undo the change. |
2 |
Group Accordion |
Click to open the group accordion to view and edit samples. When clicked, unassigned samples section will be the default sample selected, which allows you to quickly drag and drop to create multiple samples for the group. |
3 |
Plate Representation |
Drag and drop here to add new samples or edit existing samples. |
4 |
Delete All Samples |
Deletes all samples across all groups |
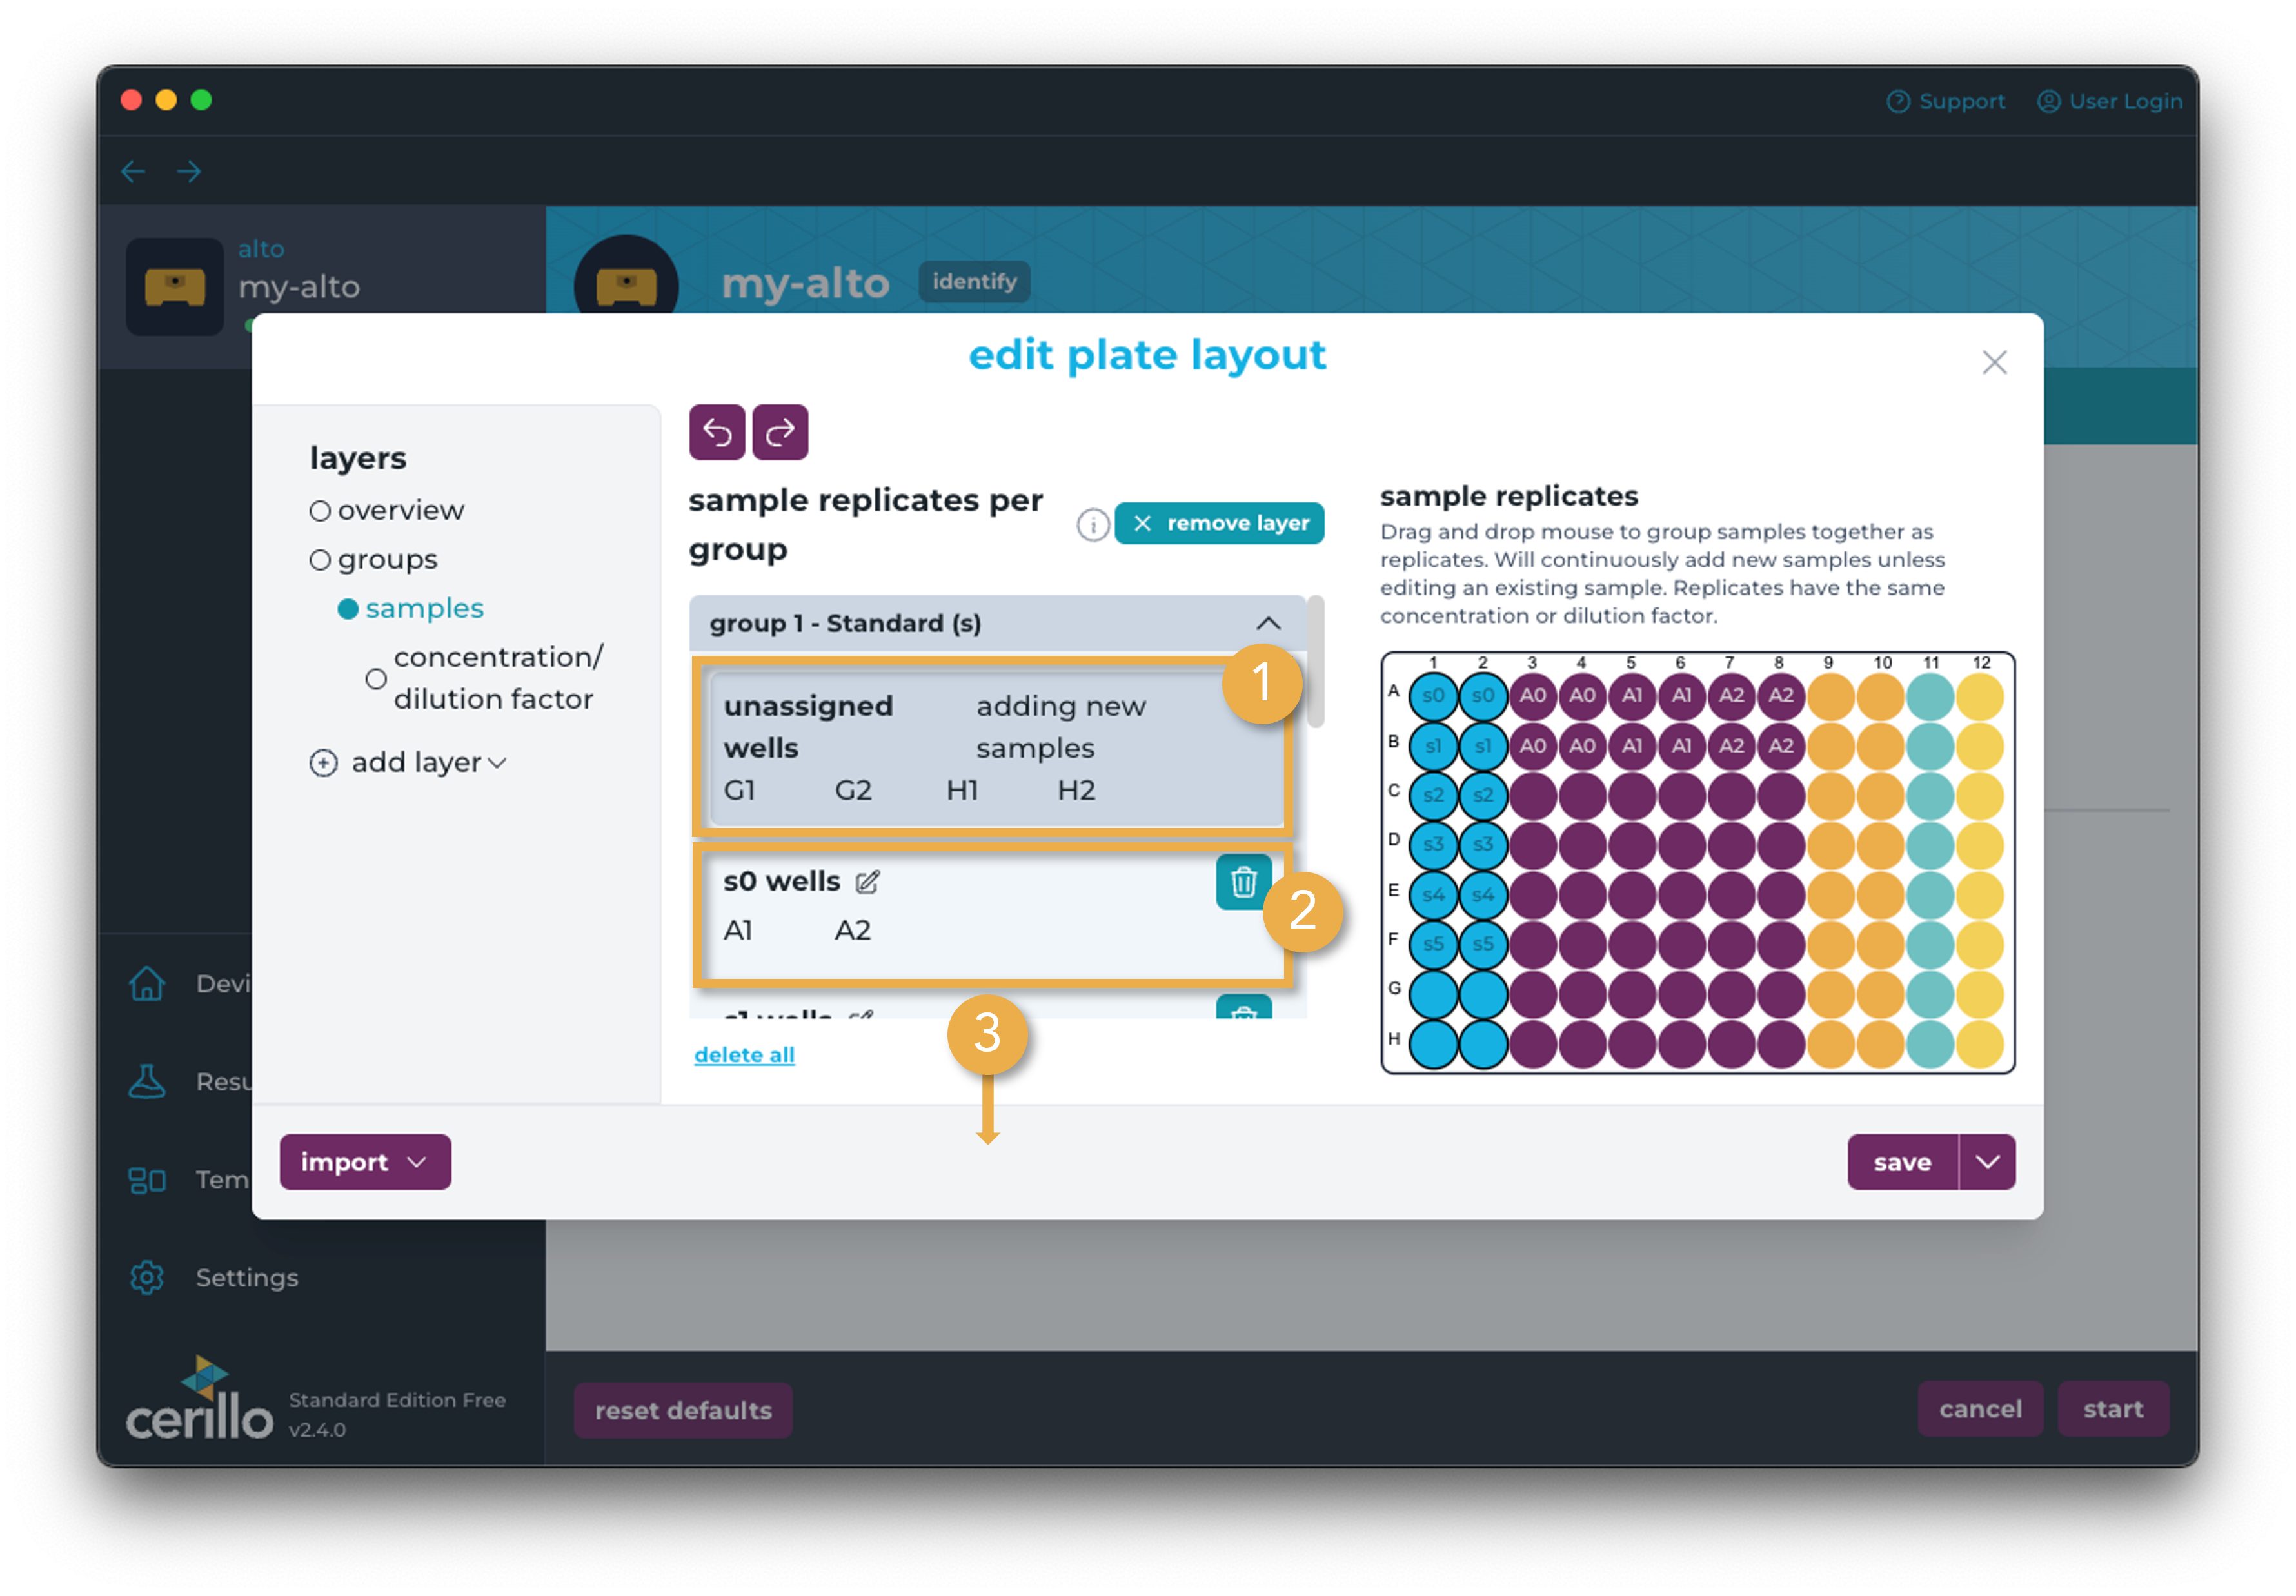
Number |
Element |
Description |
|---|---|---|
1 |
Unassigned Wells |
Click here to add unassigned wells to a new sample. This makes it easier to quickly add multiple samples. |
2 |
Sample Edit |
Click to edit this sample to add or remove wells assigned. Click the Trash Icon to remove the sample |
3 |
Remove All Sample Assignments |
Deletes all samples for this specific group. Does not affect other groups. Must Scroll to bottom of group accordion to see this button. groups |
Concentrations and dilution factors for samples are entered in the concentration/dilution factor layer. Sample from a Standard group have concentrations assigned to them while other groups use dilution factors. Concentrations are the known concentrations of whatever reagent is in your standard sample, while dilution factors are the amount that you diluted your unknown sample. Concentration values displayed in the UI will usually indicate whether they are concentration (derived from the standard curve) or concentration * dilution factor.
Samples with dilution factors can be added to kinetic experiments as well, but those dilution factors won’t be used numerically in any kinetic analysis or in visualizations.
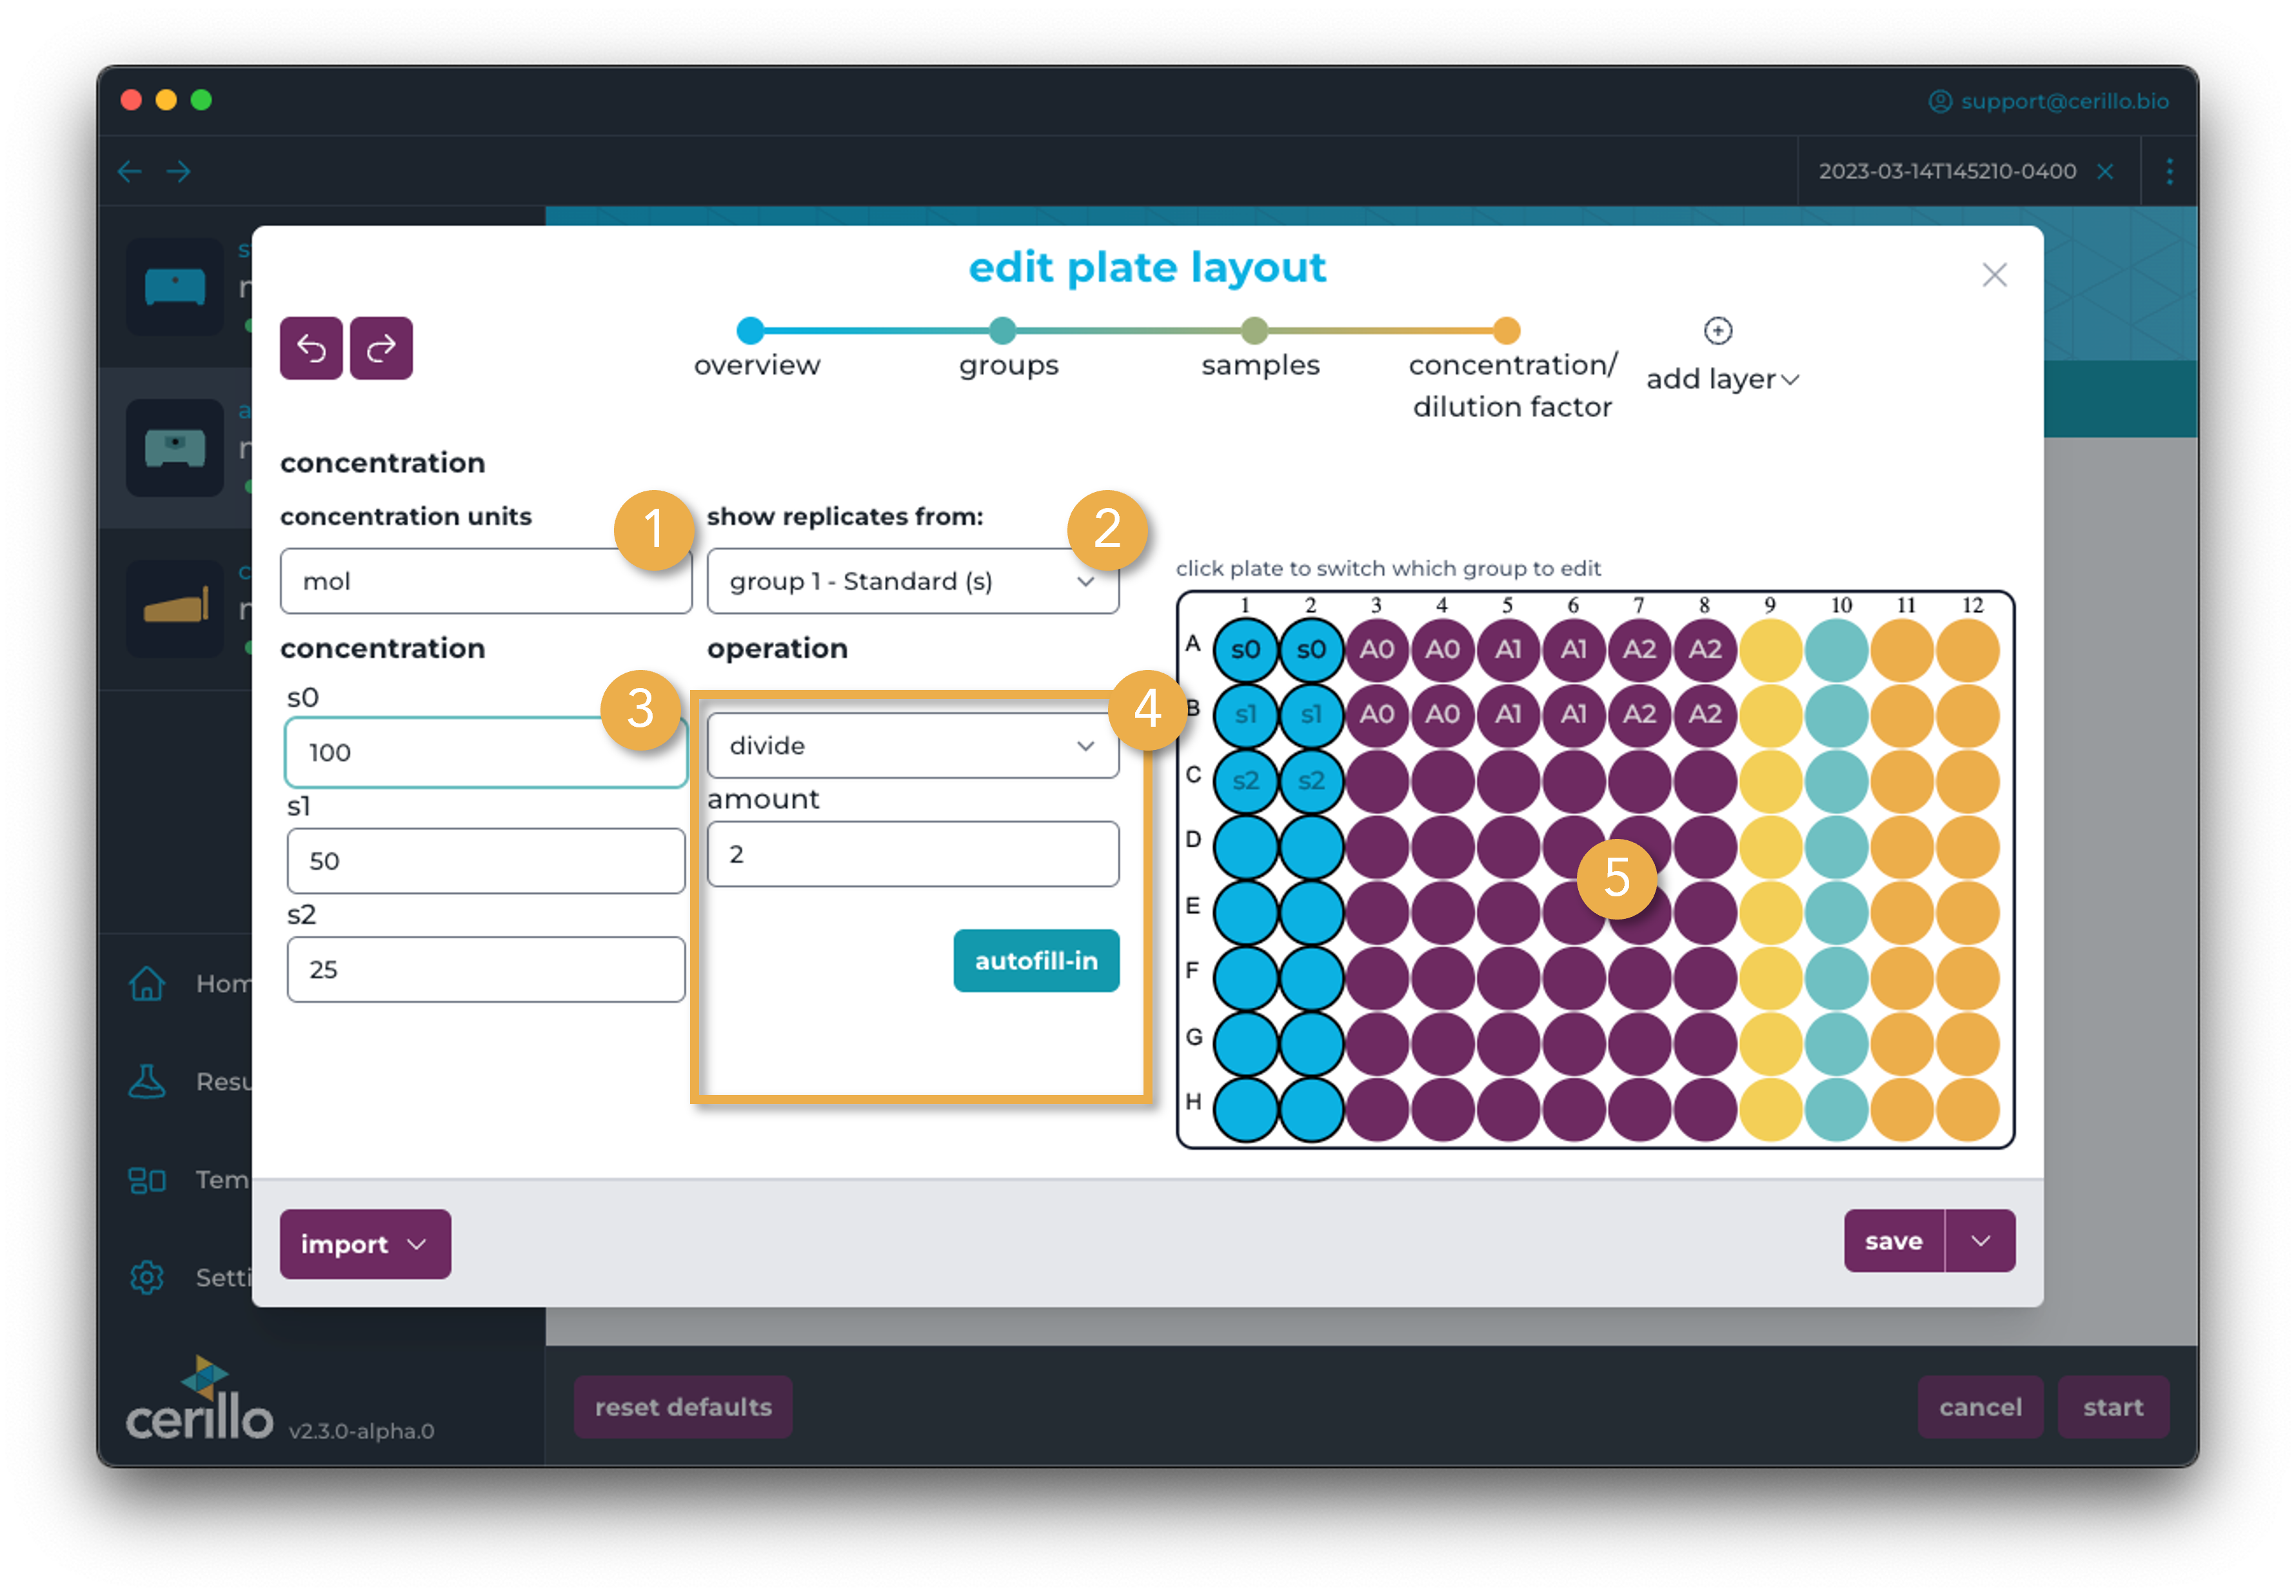
Number |
Element |
Description |
|---|---|---|
1 |
Concentration Unit |
The unit of concentration for standard samples |
2 |
Show Replicates From Select |
Select which group’s samples you would like to edit the concentration or dilution factors for. |
3 |
Concentration / Dilution Factor Input |
Modify the concentration (for standard group) or dilution factor (for other group types) with these inputs. The sample effected will be highlighted when the input is selected. |
4 |
Autofill |
Enter a numeric value to the first sample concentration, and click autofill-in to fill in the remaining concentrations. For example, if the initial concentration was 1 and it was diluted by 2 for every following sample, you could enter Divide as the operation with a Fold of 2 to fill in the remaining samples automatically. Multiply, add and subtract operations are also available for autofilling concentrations. |
5 |
Plate |
Click on a group to switch to display samples/replicates from that group. |
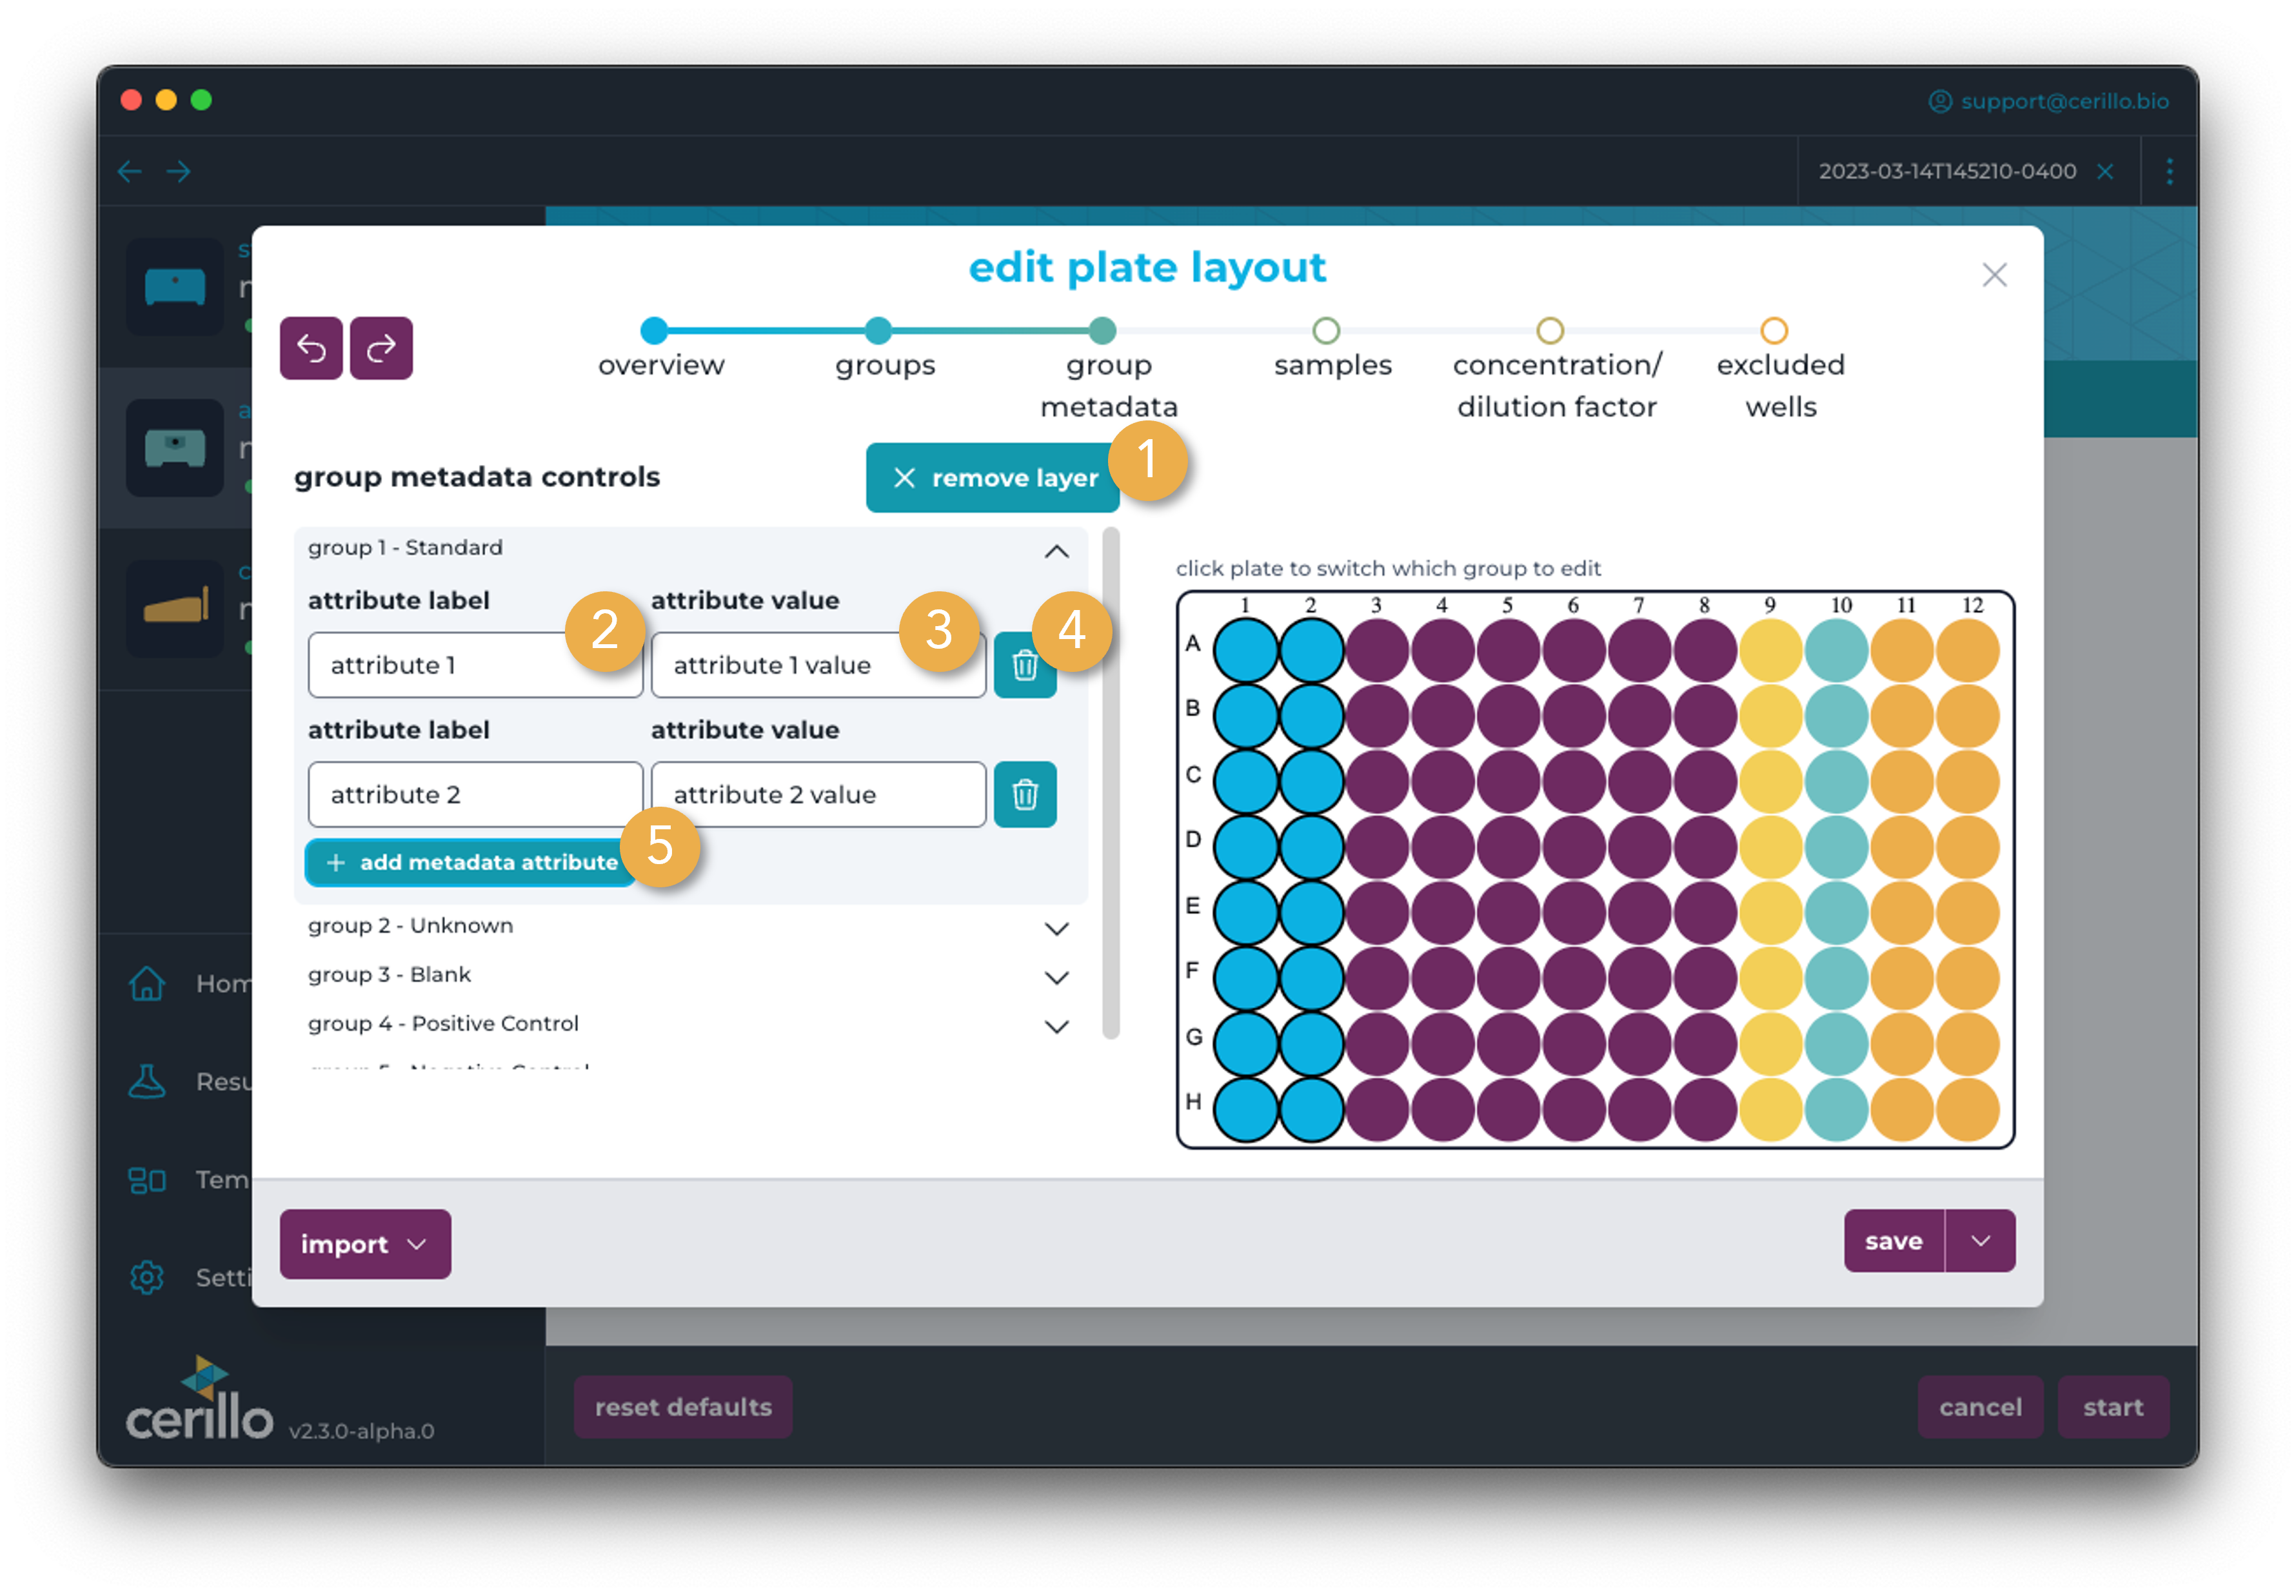
Group Metadata Layer
Similar to the samples layer, the group metadata layer displays groups in a list, and allows you to add metadata to specific groups. This metadata is stored but is not used in visualizations or calculations.
Number |
Element |
Description |
|---|---|---|
1 |
Remove Layer |
Remove the group metadata layer. All group metadata will be erased if the layer is removed. If removed by accident, use the undo button to undo the change. |
2 |
Attribute Label Input |
Edit the label of the attribute |
3 |
Attribute Label Value |
Edit the value of the attribute |
4 |
Remove Attribute |
Remove the metadata attribute |
5 |
Add Metadata Attribute |
Add a new metadata attribute |
Inputting Standard Curve Information
When setting up an endpoint experiment, the plate layout dialog appears slightly differently. It already has the sample layer added to it to simplify standard sample information entry needed to generate a standard curve. Entering standard curve information is a three step process. The first step is to set up groups. One group must be of type Standard and contain wells to move to the next step. The second step is to assign samples to the standard group, and the third step is to assign known concentrations to samples.